Fig. 4
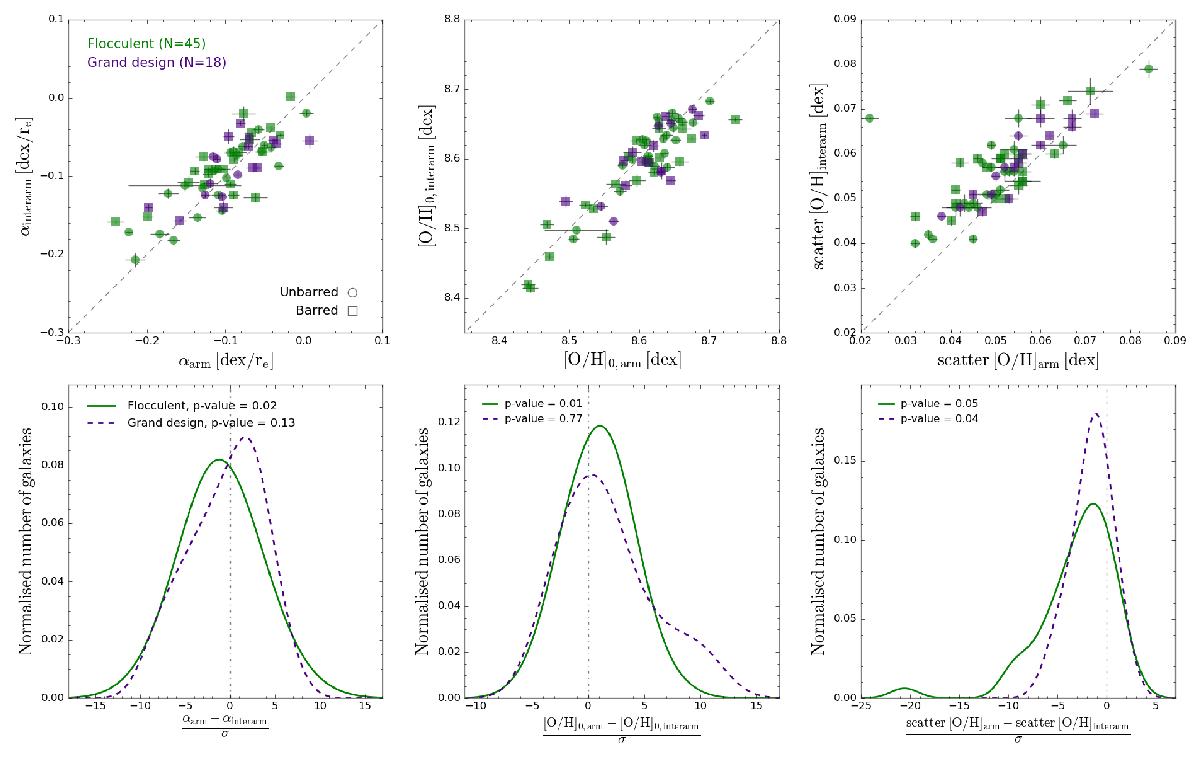
Top panels: relation between the slope values (left), zero-points (middle) and scatter (right) of the radial linear fit performed considering arm gas abundance values (x-axes) and interarm values (y-axes). Flocculent galaxies are represented by green markers and grand design galaxies by purple markers. Squares and circles indicate barred and unbarred galaxies, respectively. The dashed grey lines represent the one-to-one relation. Bottom panels: normalised distributions of the differences between the slope values (left), zero-points (middle) and scatter (right) of the interarm and arm regions divided by the quadratic sum of the errors derived for each galaxy. Green solid histograms represent the flocculent distributions and purple dashed histograms represent the distributions for the grand designs. The dashed dotted grey lines correspond to the zero value, indicating no differences between arm and interarm regions. The results of the t-tests are shown in the top left corners of the panels (see text for details).
Current usage metrics show cumulative count of Article Views (full-text article views including HTML views, PDF and ePub downloads, according to the available data) and Abstracts Views on Vision4Press platform.
Data correspond to usage on the plateform after 2015. The current usage metrics is available 48-96 hours after online publication and is updated daily on week days.
Initial download of the metrics may take a while.