Fig. 3
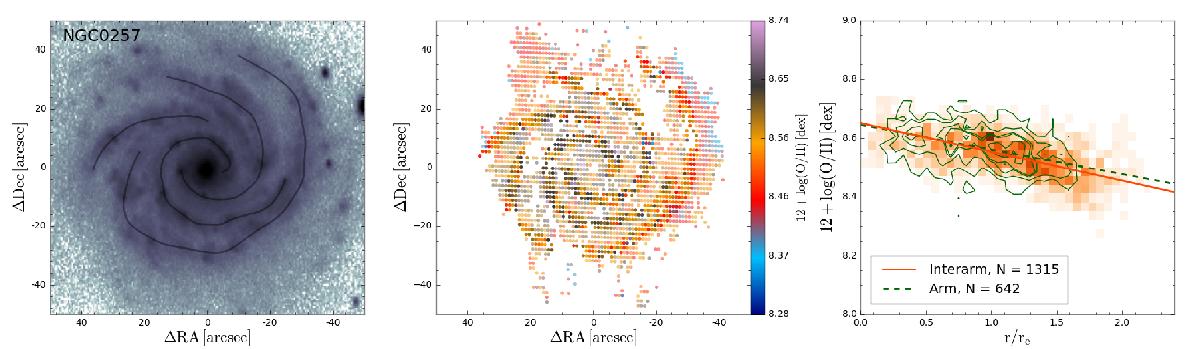
NGC 0257. Left panel: outline of the spiral arms on the deprojected SDSS g-band map. Middle panel: colour map of the oxygen abundance distribution of the spiral arms (opaque dots) and the interarm region (transparent dots). Right panel: radial density distribution in the oxygen abundance-galactocentric distance space of the spaxels located in the spiral arms (green contours) and those associated with the interarm region (orange colour map). The outermost contour encircles 100% of the total number of spaxels, decreasing by 20% in each consecutive contour. The lines represent the error-weighted linear fit derived for the arm (green dashed line) and interarm (orange solid line) distributions. The inset indicates the number of spaxels of each distribution that contribute to the derivation of the gradient, i.e. located within the radial range 0.5–2.0 re.
Current usage metrics show cumulative count of Article Views (full-text article views including HTML views, PDF and ePub downloads, according to the available data) and Abstracts Views on Vision4Press platform.
Data correspond to usage on the plateform after 2015. The current usage metrics is available 48-96 hours after online publication and is updated daily on week days.
Initial download of the metrics may take a while.