Fig. 4
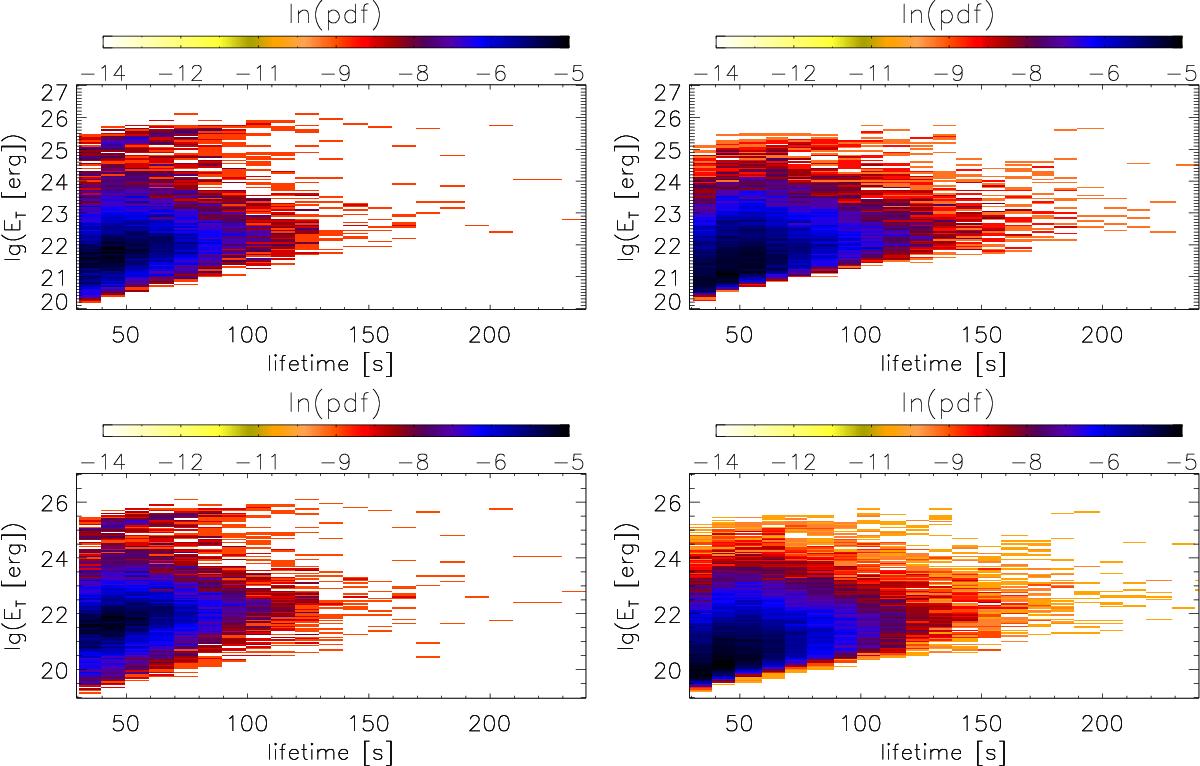
Probability distribution function of the total energy ![]() of the individual SSHEs vs. their lifetime considering SSHEs selected using different backgrounds for the LRM (left) and HRM (right). The backgrounds are 1018 erg s-1 and 1017 erg s-1 for the top and bottom panels, respectively. The darker regions correspond to a high concentration of SSHEs, light yellow regions to low concentration, and white to locations where there are no SSHEs.
of the individual SSHEs vs. their lifetime considering SSHEs selected using different backgrounds for the LRM (left) and HRM (right). The backgrounds are 1018 erg s-1 and 1017 erg s-1 for the top and bottom panels, respectively. The darker regions correspond to a high concentration of SSHEs, light yellow regions to low concentration, and white to locations where there are no SSHEs.
Current usage metrics show cumulative count of Article Views (full-text article views including HTML views, PDF and ePub downloads, according to the available data) and Abstracts Views on Vision4Press platform.
Data correspond to usage on the plateform after 2015. The current usage metrics is available 48-96 hours after online publication and is updated daily on week days.
Initial download of the metrics may take a while.