Fig. 2
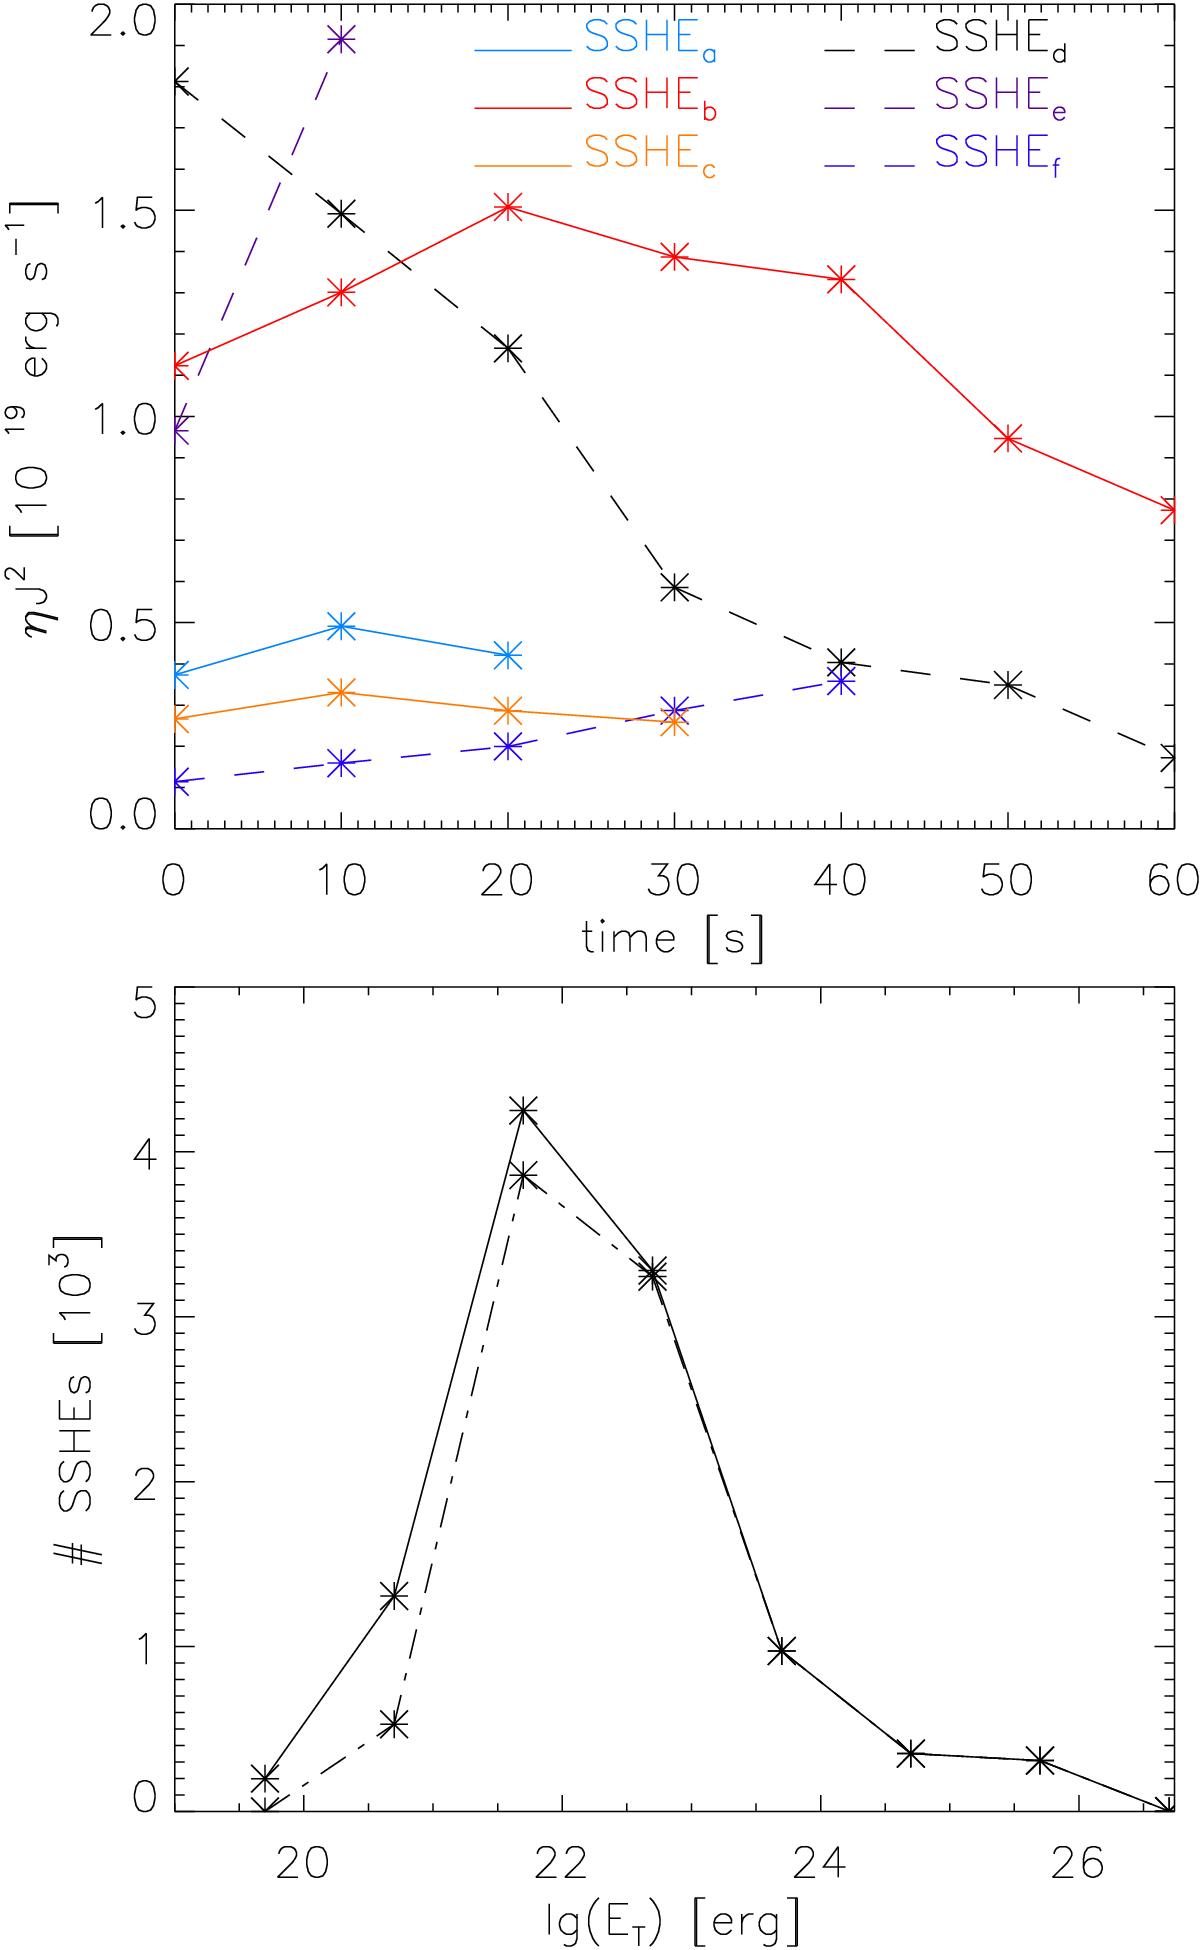
Top panel: six SSHEs tracked by the method over their lifetime in the LRM. The data points show the value of the Joule heating ![]() at the location (cell) of maximum dissipation of the SSHEs while they are above the background, which in this case is chosen as 1017 erg s-1. The data points connected by a solid line represent the SSHEs considered in the statistics while those connected by a dashed line represent the disregarded SSHEs. Bottom panel: Number of SSHEs with a clear rising and decaying phase inside each energy decade ranging from 1 × 10¹⁹ to 1 × 1027 erg for two different backgrounds 1018 erg s-1 (dashed line) and 1017 erg s-1 (solid line) for the LRM.
at the location (cell) of maximum dissipation of the SSHEs while they are above the background, which in this case is chosen as 1017 erg s-1. The data points connected by a solid line represent the SSHEs considered in the statistics while those connected by a dashed line represent the disregarded SSHEs. Bottom panel: Number of SSHEs with a clear rising and decaying phase inside each energy decade ranging from 1 × 10¹⁹ to 1 × 1027 erg for two different backgrounds 1018 erg s-1 (dashed line) and 1017 erg s-1 (solid line) for the LRM.
Current usage metrics show cumulative count of Article Views (full-text article views including HTML views, PDF and ePub downloads, according to the available data) and Abstracts Views on Vision4Press platform.
Data correspond to usage on the plateform after 2015. The current usage metrics is available 48-96 hours after online publication and is updated daily on week days.
Initial download of the metrics may take a while.