Fig. 1
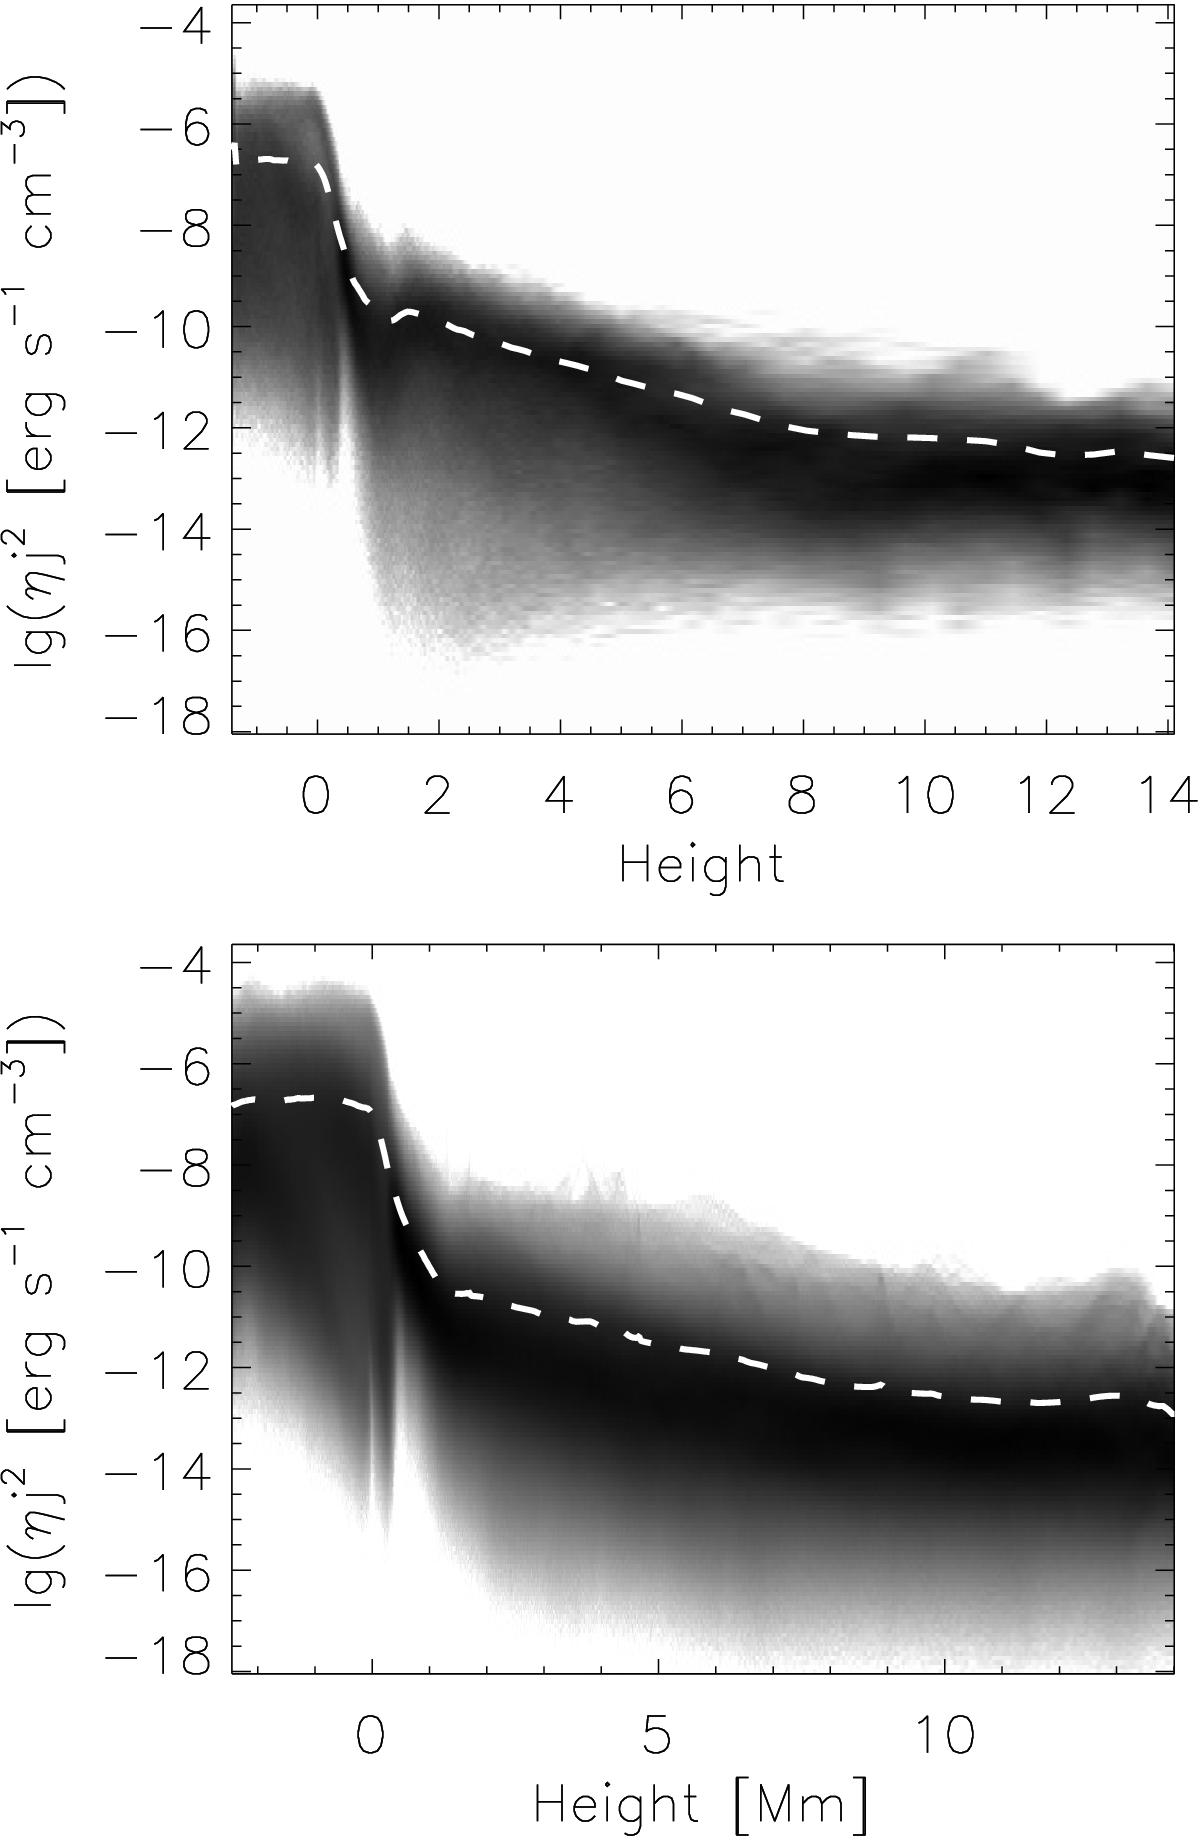
Top panel: Joule heating ![]() at t = 2000 s as a function of height for the LRM. Bottom panel: Joule heating
at t = 2000 s as a function of height for the LRM. Bottom panel: Joule heating ![]() at t = 600 s as a function of height for the HRM. In both panels the dark regions stand for high concentration of data points, gray regions for low concentration, and white for the absence of data points. The white dashed lines give the average ηJ2 as a function of height.
at t = 600 s as a function of height for the HRM. In both panels the dark regions stand for high concentration of data points, gray regions for low concentration, and white for the absence of data points. The white dashed lines give the average ηJ2 as a function of height.
Current usage metrics show cumulative count of Article Views (full-text article views including HTML views, PDF and ePub downloads, according to the available data) and Abstracts Views on Vision4Press platform.
Data correspond to usage on the plateform after 2015. The current usage metrics is available 48-96 hours after online publication and is updated daily on week days.
Initial download of the metrics may take a while.