Fig. 2
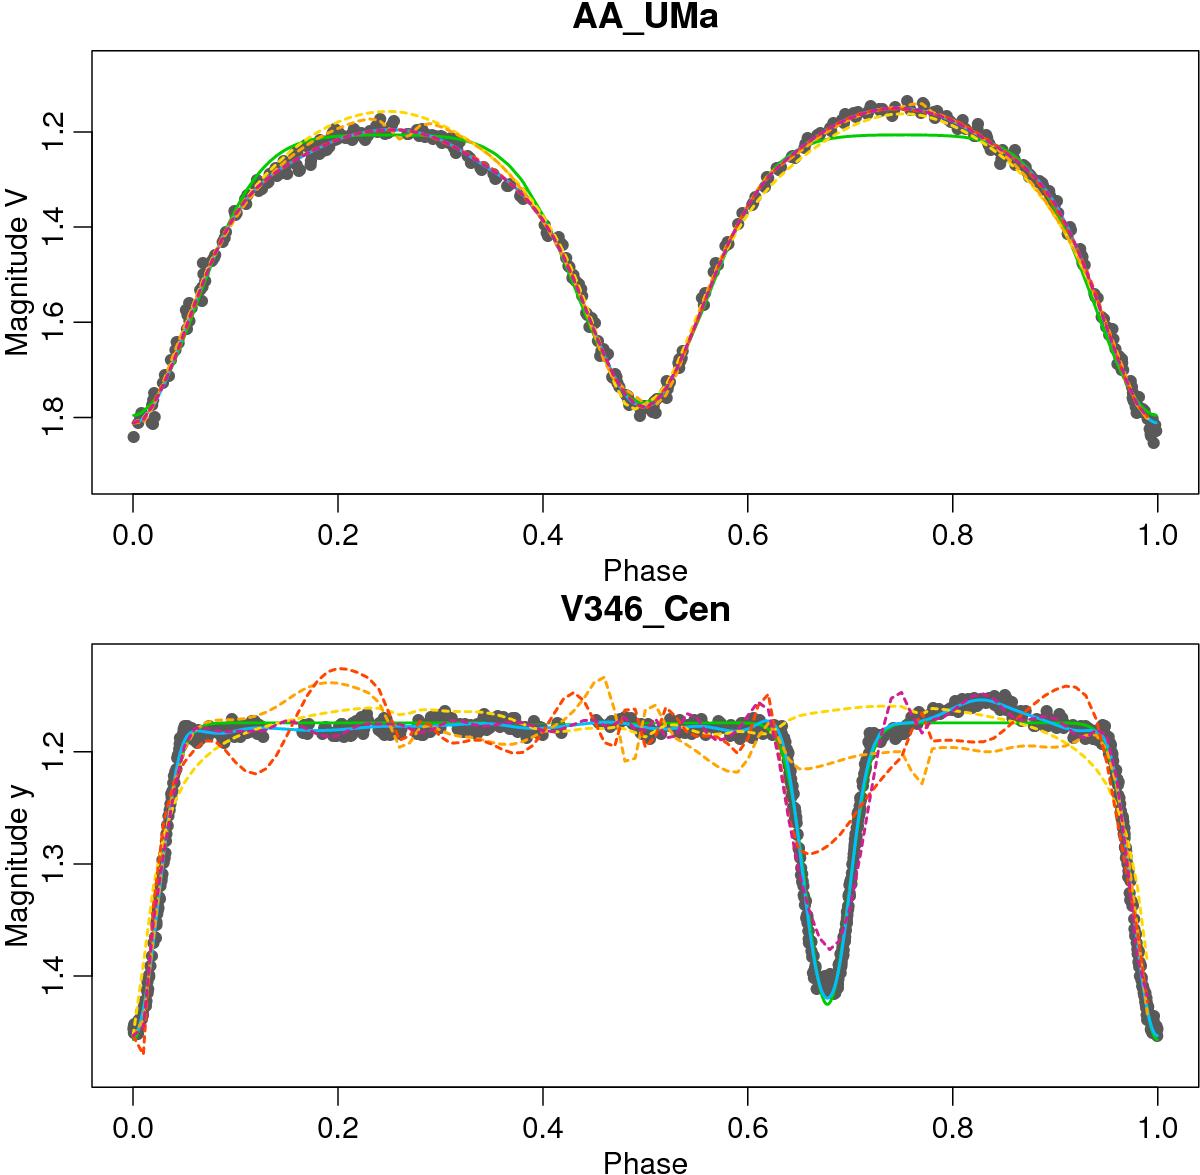
Two examples, AA UMa (period: 0.4681258 days) and V346 Cen (period: 6.3219350 days) for the successive time series preprocessing steps (the black dots indicate the data taken from CALEB). The magnitudes for AA UMa are V magnitudes from Wang & Lu (1990), for V346 Cen, Strömgren y from Gimenez et al. (1986). Green solid line: the double Gaussian fit, blue solid line: double Gaussian + smooth spline fit, dashed lines: principal component reconstructions up to different orders. Gold: PC1-PC4 (95% of the total variation), orange: PC1-PC11 (99%), red: PC1-PC21 (99.9%), violetred: PC1-PC36 (99.999%). The light curves reconstructed from the PCA decomposition are scaled back from between [0, 1] to the original scale of the data.
Current usage metrics show cumulative count of Article Views (full-text article views including HTML views, PDF and ePub downloads, according to the available data) and Abstracts Views on Vision4Press platform.
Data correspond to usage on the plateform after 2015. The current usage metrics is available 48-96 hours after online publication and is updated daily on week days.
Initial download of the metrics may take a while.