Free Access
Fig. 17
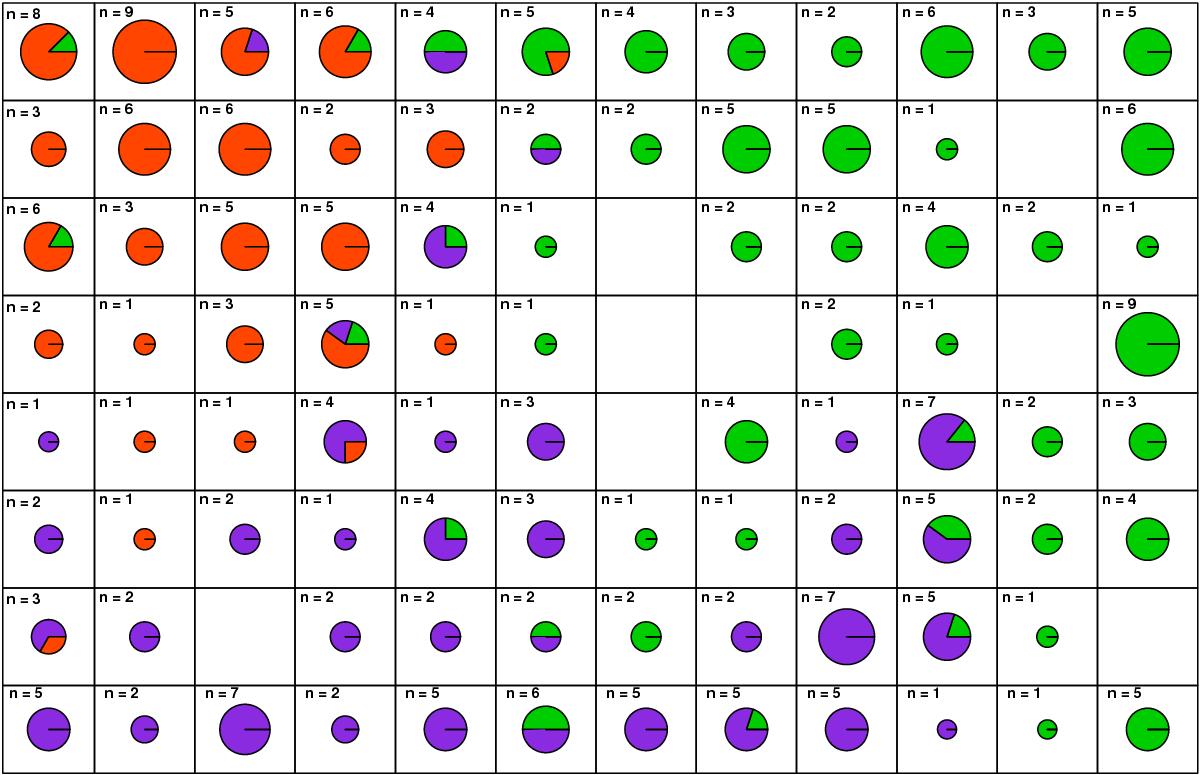
Relative populations of the system morphology classes of CALEB in the 2-dimensional reduced space of the SOM. Red: overcontact, violet: semidetached, near-contact and contact, green: detached binaries. The area of the plotted piechart is proportional to the fraction of objects belonging to the cell in the full population.
Current usage metrics show cumulative count of Article Views (full-text article views including HTML views, PDF and ePub downloads, according to the available data) and Abstracts Views on Vision4Press platform.
Data correspond to usage on the plateform after 2015. The current usage metrics is available 48-96 hours after online publication and is updated daily on week days.
Initial download of the metrics may take a while.