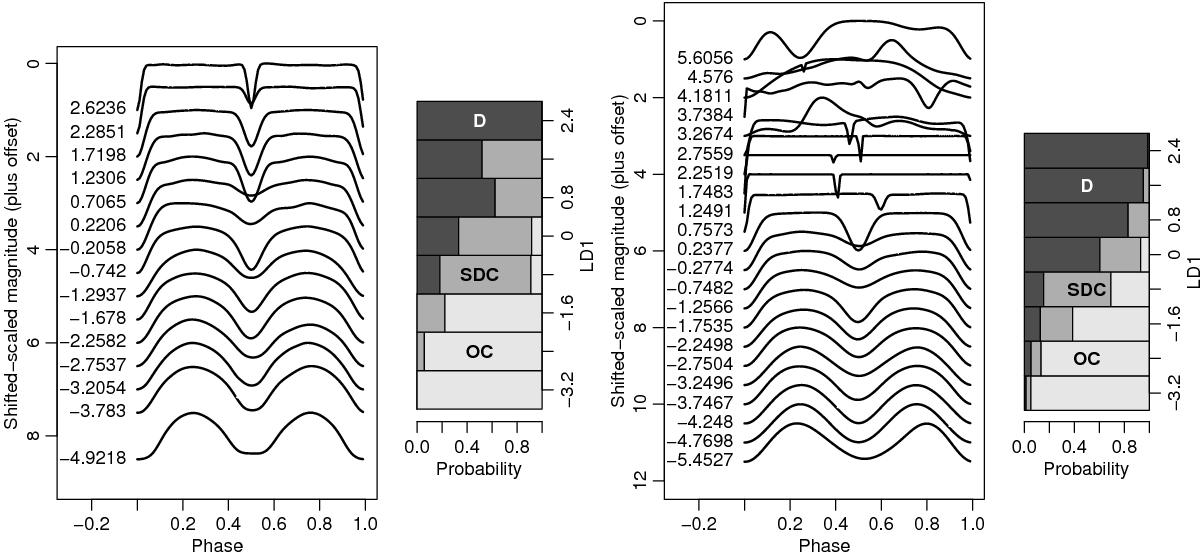
Fig. 12

Interpolated-scaled-shifted light curves from CALEB, ordered by their coefficients on LD1 (leftmost panel), the distribution of the system morphology classes by bins of LD1 scores (second panel from left), and the same for Gaia-sampled Kepler eclipsing binaries. In the panels showing the light curves (first and third panels), offsets were added for the sake of visibility. In the barplot panels, dark grey corresponds to detached systems, mid-grey, to semi-detached, near-contact and contact ones, and light grey, to overcontact ones.
Current usage metrics show cumulative count of Article Views (full-text article views including HTML views, PDF and ePub downloads, according to the available data) and Abstracts Views on Vision4Press platform.
Data correspond to usage on the plateform after 2015. The current usage metrics is available 48-96 hours after online publication and is updated daily on week days.
Initial download of the metrics may take a while.


