Fig. 10
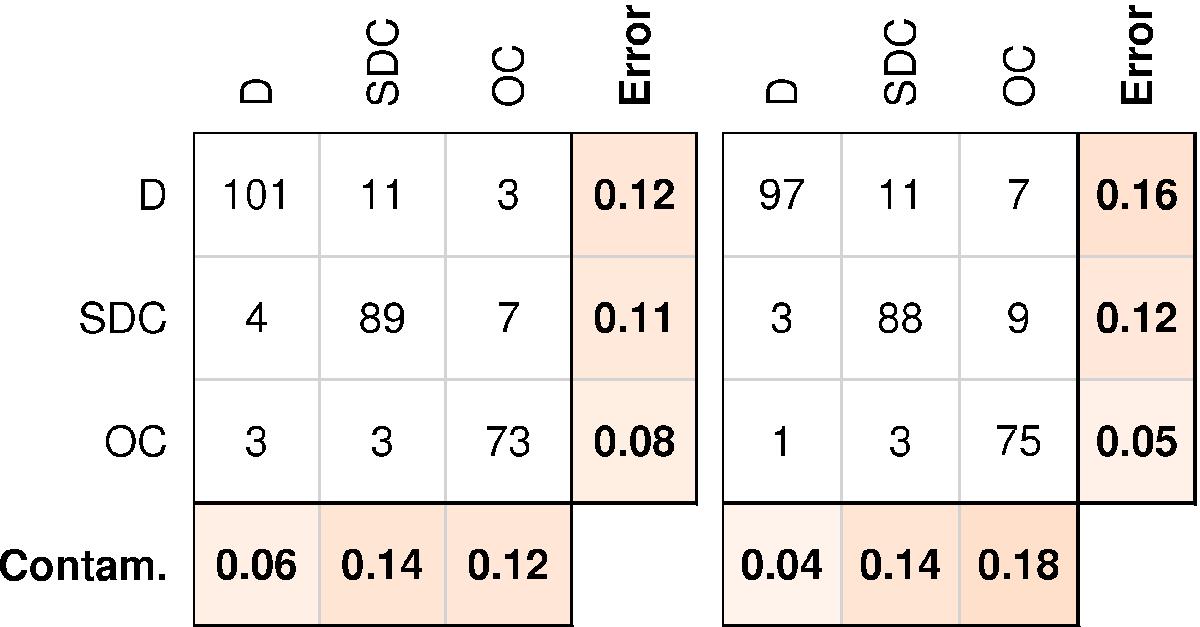
Confusion matrices based on the aggregated results of the 500 randomized Random Forest (left) and LDA (right) classifiers for the system morphology classes, using the 500 random training set/test set partitions on CALEB. The numbers in the white boxes are absolute numbers, those in the orange boxes are fractions (bottom row: contamination rate in the estimated class, rightmost column: error rate).
Current usage metrics show cumulative count of Article Views (full-text article views including HTML views, PDF and ePub downloads, according to the available data) and Abstracts Views on Vision4Press platform.
Data correspond to usage on the plateform after 2015. The current usage metrics is available 48-96 hours after online publication and is updated daily on week days.
Initial download of the metrics may take a while.