Fig. B.1
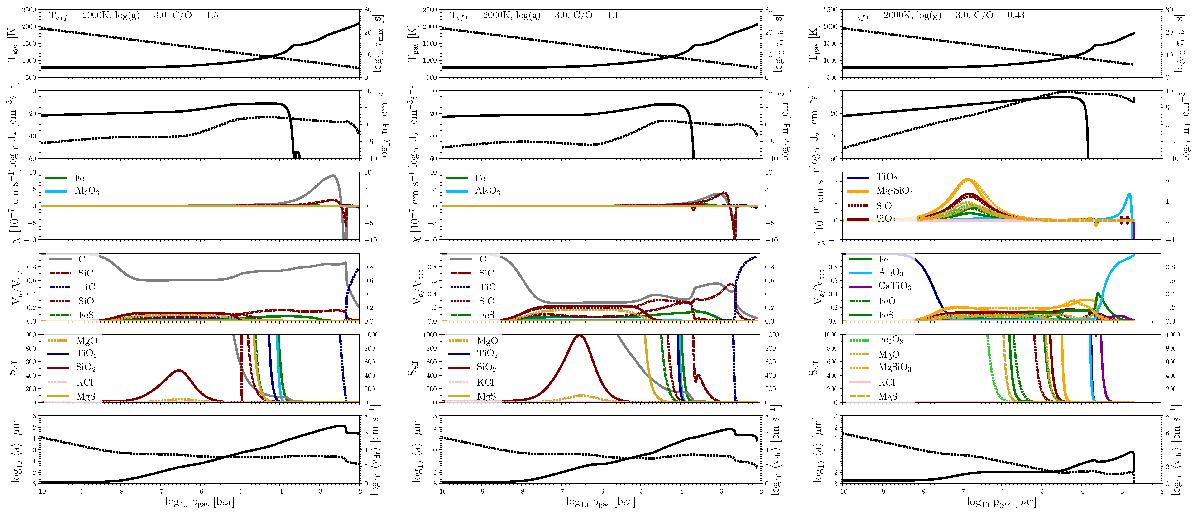
Download original image
Detailed information about the cloud structure forming in an atmospheric gas with initial C/O ratios of 0.43, 1.1, 1.5 and a prescribed Drift-Phoenix atmosphere profile for Teff = 2000 K and log(g) = 3.0. 1st row: local gas temperature Tgas [K] (solid, left), mixing timescale τmix [s] (dashed, right); 2nd row: seed formation rate J∗ [cm-3 s-1 ] (solid, left), number density of cloud particles nd [cm-3] (right, dashed), 3rd row: net growth velocity for individual materials s; 4th row: volume fraction Vs/Vtot for material s; 5th row: effective supersaturation ratio Seff for each material s; 6th row: mean cloud particles radius ⟨ a ⟩ [μm], drift velocity vdrift [cm s-1] with respect to the local ⟨ a ⟩. The color code is the same for all panels. All quantities are plotted vs. the local gas pressure pgas [bar].

Current usage metrics show cumulative count of Article Views (full-text article views including HTML views, PDF and ePub downloads, according to the available data) and Abstracts Views on Vision4Press platform.
Data correspond to usage on the plateform after 2015. The current usage metrics is available 48-96 hours after online publication and is updated daily on week days.
Initial download of the metrics may take a while.