Fig. 7
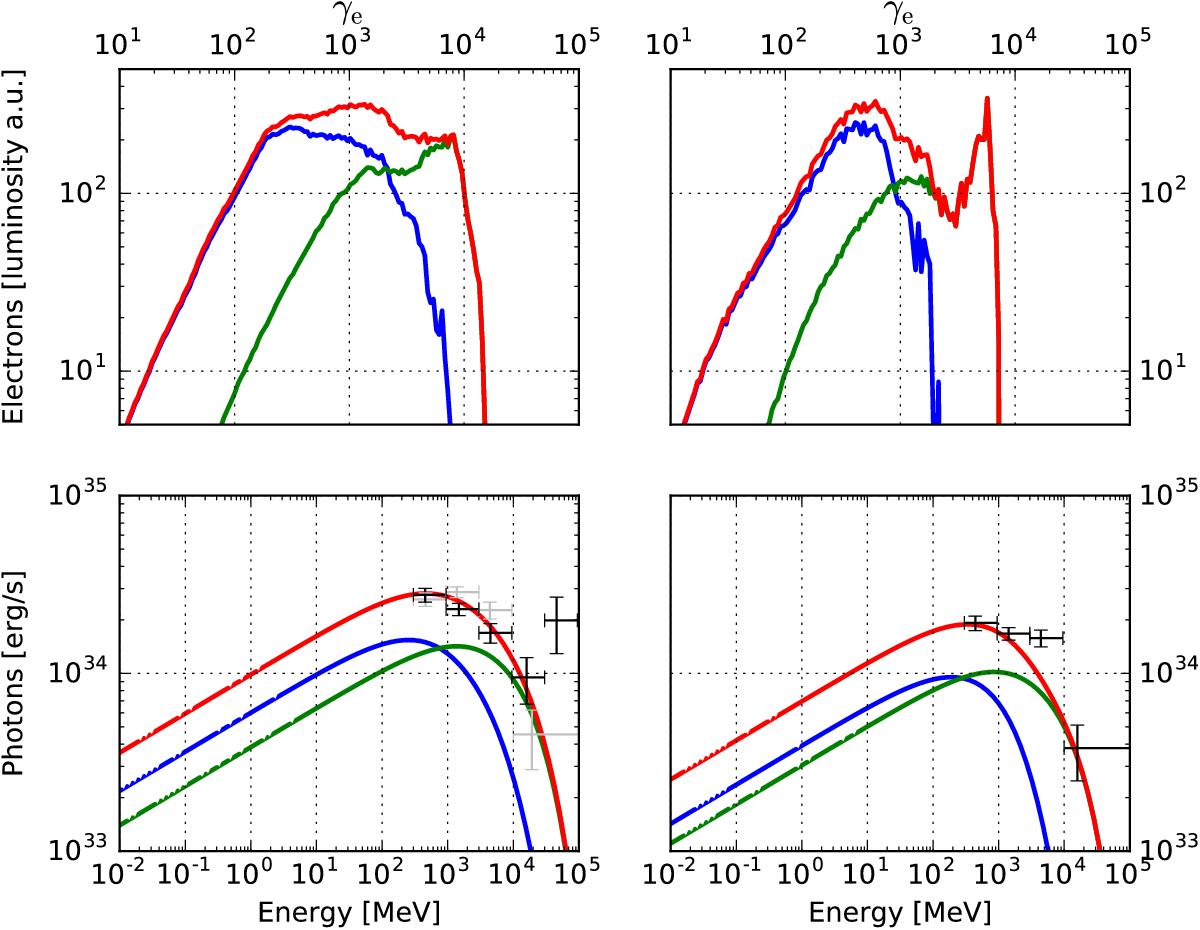
Electrons and photons luminosity spectra at periastron (phase 0.92–1.06; left) and at apastron (phase 0.39–0.59; right). The top panels show the spectra (arbitrary units) of the electrons accelerated in the wind of the primary (blue) and secondary (green) stars and their sum (red). The lower panels show the inverse-Compton emission of both components and the total emission, under the highly simplified assumption that the inverse-Compton parameters (geometry and soft photon spectra) are the same in all cells. The black and grey points are the broadband fluxes derived from Fermi data for the first and the second orbital cycle, respectively. The simulation results were averaged over the orbital phase range corresponding to the periastron observation, as the electron spectra vary quickly during that interval.
Current usage metrics show cumulative count of Article Views (full-text article views including HTML views, PDF and ePub downloads, according to the available data) and Abstracts Views on Vision4Press platform.
Data correspond to usage on the plateform after 2015. The current usage metrics is available 48-96 hours after online publication and is updated daily on week days.
Initial download of the metrics may take a while.