Fig. 5
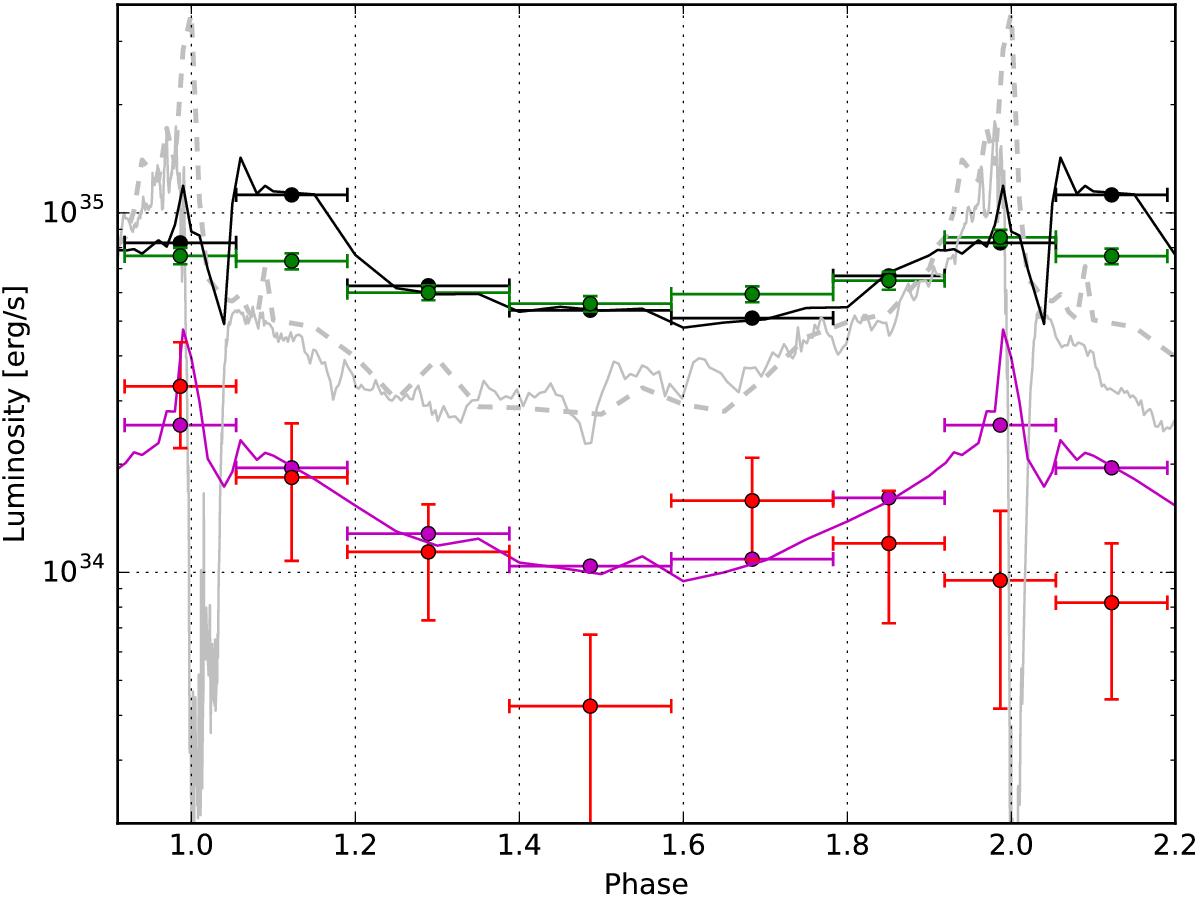
Simulated and observed X-ray and γ-ray light curves of η Carinae. The black and purple lines and bins show the predicted inverse-Compton and neutral pion decay light curves. The green and red points show the observed Fermi-LAT light curves at low (0.3–10 GeV) and high (10–300 GeV) energies. The dim grey light curves show the observed (continuous) and predicted (dash, without obscuration) thermal X-ray light curves. Error bars are 1σ.
Current usage metrics show cumulative count of Article Views (full-text article views including HTML views, PDF and ePub downloads, according to the available data) and Abstracts Views on Vision4Press platform.
Data correspond to usage on the plateform after 2015. The current usage metrics is available 48-96 hours after online publication and is updated daily on week days.
Initial download of the metrics may take a while.