Fig. 2
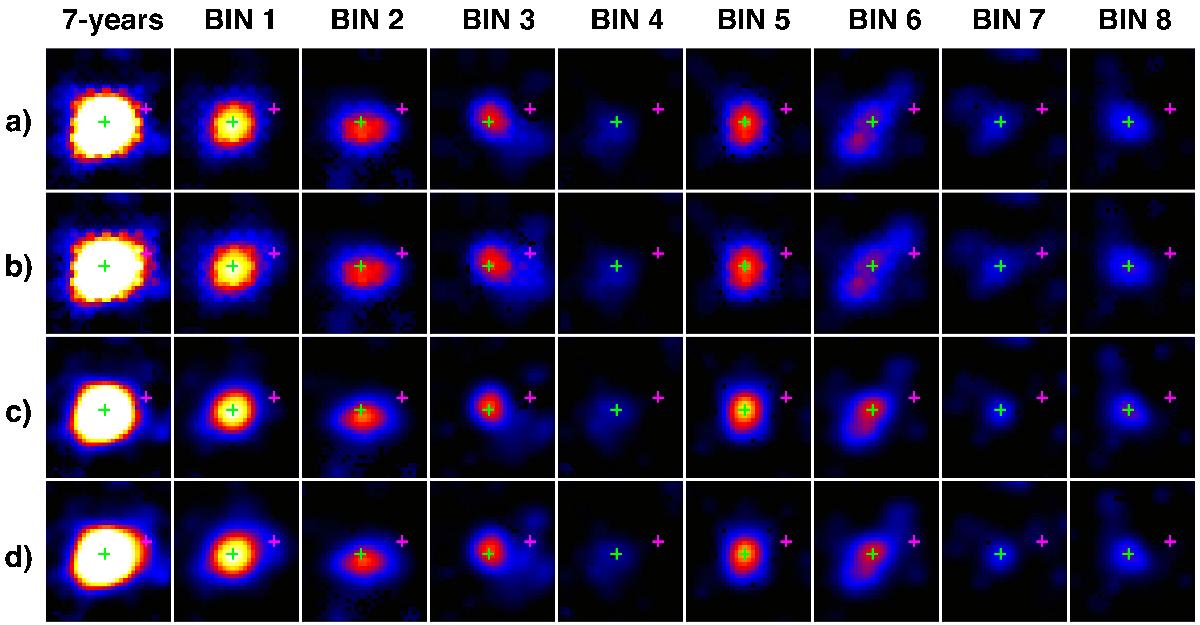
High-energy TS maps for each of the time intervals, corrected for the small differences of exposure times between the 8 phase bins such that the images illustrate the source variability. Each image has the same width (0.77°). Rows a) and b) show TS maps obtained from the binned analysis, respectively including and excluding J1043 from the model. Rows c) and d) represent the same as a) and b) but from the unbinned analysis. The linear colour map spans TS from 0 to 100. The green and purple crosses are the positions of η Carinae and J1043.
Current usage metrics show cumulative count of Article Views (full-text article views including HTML views, PDF and ePub downloads, according to the available data) and Abstracts Views on Vision4Press platform.
Data correspond to usage on the plateform after 2015. The current usage metrics is available 48-96 hours after online publication and is updated daily on week days.
Initial download of the metrics may take a while.