Free Access
Fig. 1
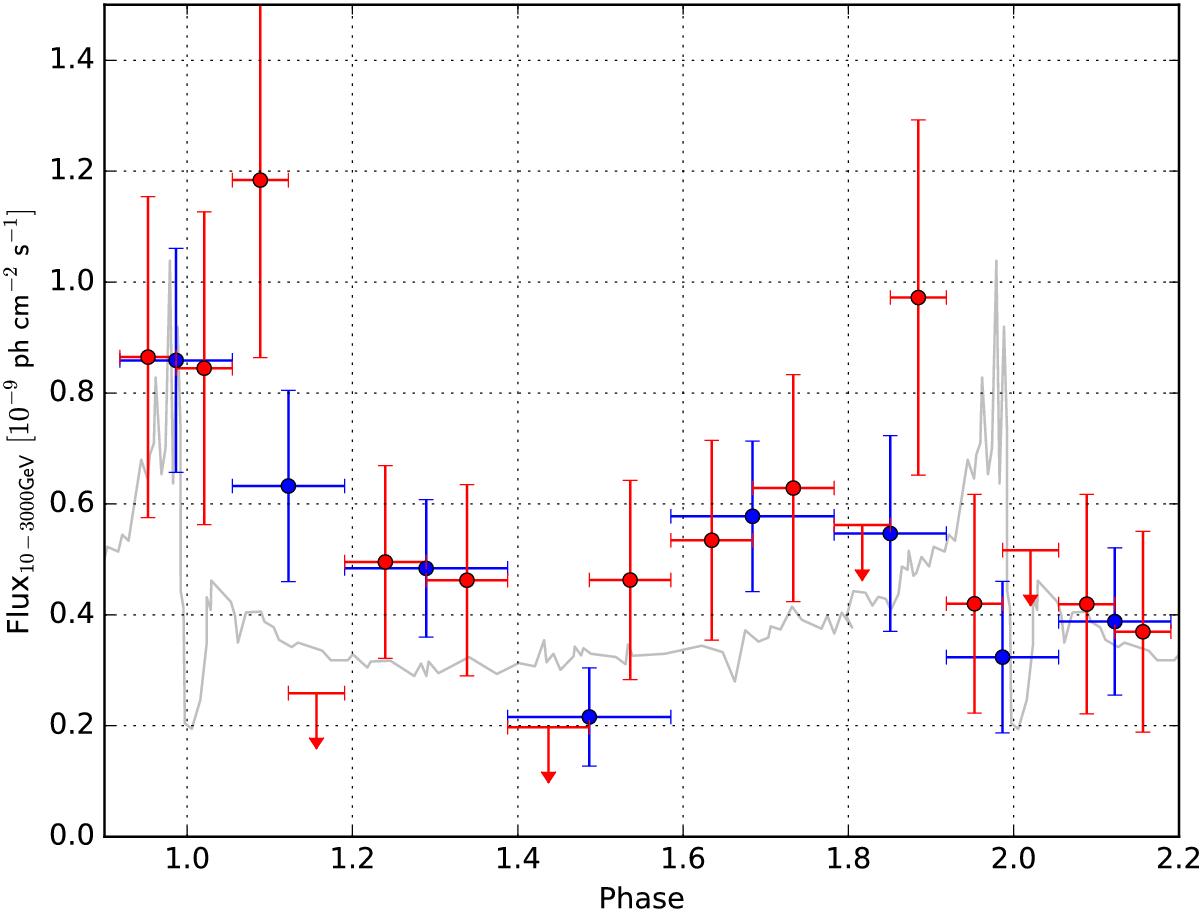
Seven-year high-energy flux light curve of η Carinae obtained from the binned analysis, using the binning as reported in Table 1 (blue points) and with a smaller binning (red points). Error bars are 1σ and superposed upper limits are 95%. For comparison we plotted an arbitrarily rescaled X-ray light curve (grey line).
Current usage metrics show cumulative count of Article Views (full-text article views including HTML views, PDF and ePub downloads, according to the available data) and Abstracts Views on Vision4Press platform.
Data correspond to usage on the plateform after 2015. The current usage metrics is available 48-96 hours after online publication and is updated daily on week days.
Initial download of the metrics may take a while.