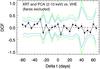
Fig. 8
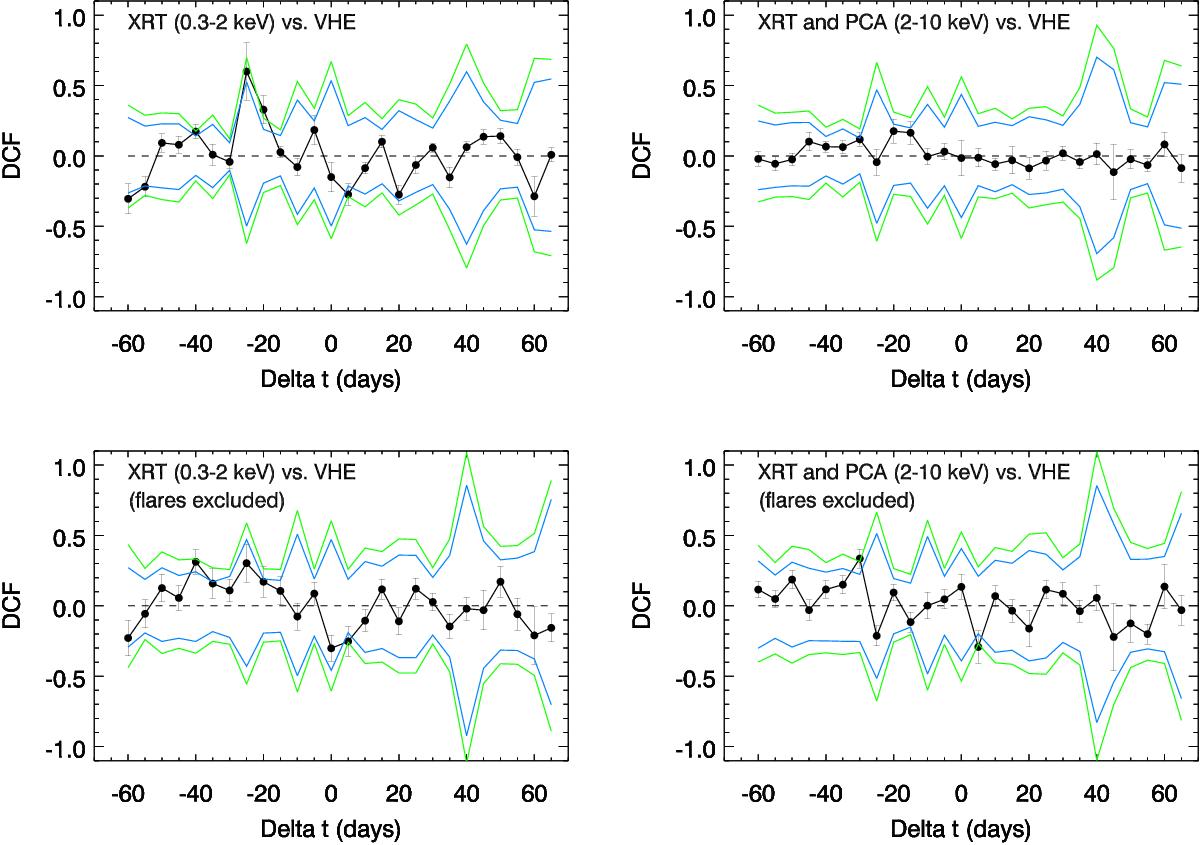
DCF derived for VHE γ rays (combined from MAGIC, VERITAS, and Whipple measurements) and two X-ray bands (Swift/XRT measurements within the 0.3−2 keV band; Swift/XRT and RXTE/PCA combined within the 2−10 keV band). The blue (green) lines depict the 95% (99%) confidence intervals derived from Monte Carlo generated light curves (see text for detailed explanation). Left: DCF of complete data sets. Right: DCF derived with the data sets after subtracting the two flaring periods (excluded time windows as explained in the text).
Current usage metrics show cumulative count of Article Views (full-text article views including HTML views, PDF and ePub downloads, according to the available data) and Abstracts Views on Vision4Press platform.
Data correspond to usage on the plateform after 2015. The current usage metrics is available 48-96 hours after online publication and is updated daily on week days.
Initial download of the metrics may take a while.