Fig. 7
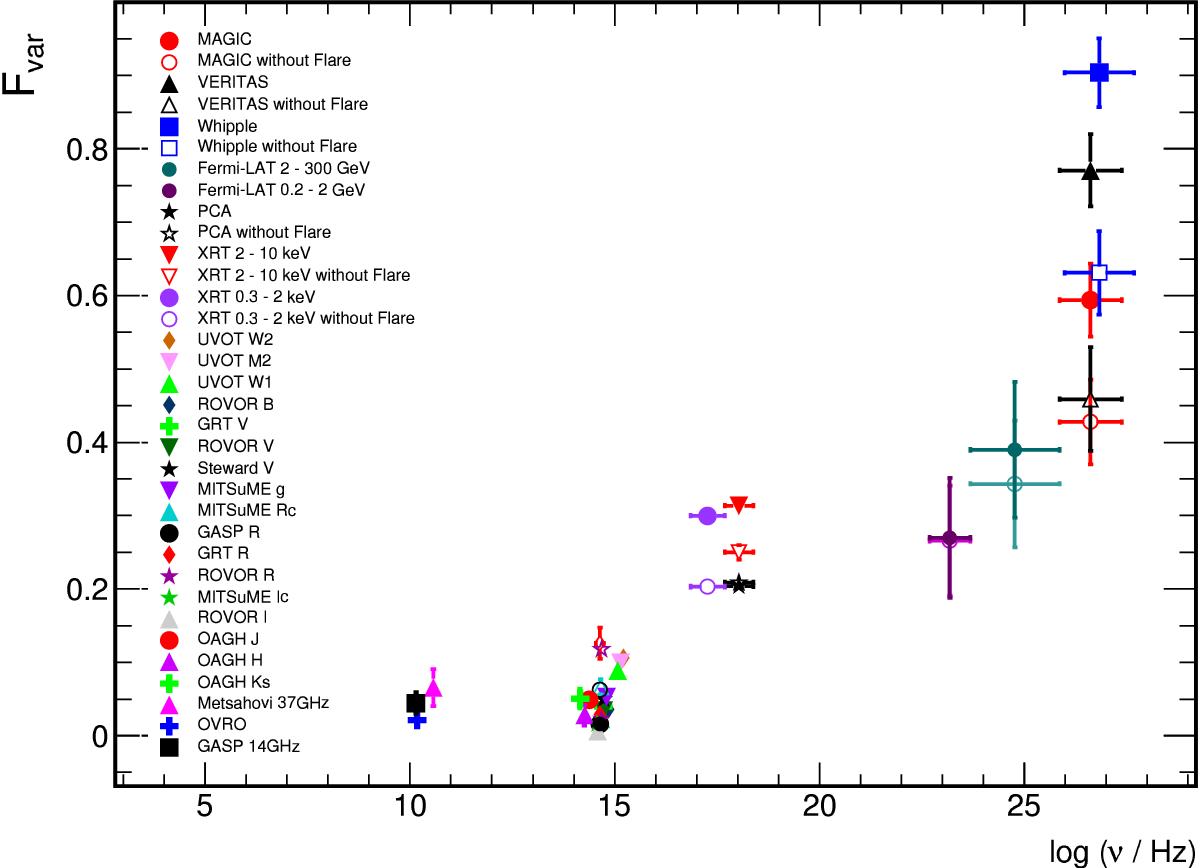
Fractional variability at different frequencies. All the Fvar values are computed with the single observations shown in Fig. 1, with the exception of the Fvar values related to Fermi-LAT which were computed with 15-day and 30-day time intervals, and depicted with full circles and open circles, respectively. Open symbols for optical bands indicate the fractional variability after subtracting the host galaxy contribution, as determined in Nilsson et al. (2007). For the X-ray and the VHE γ-ray band, open markers depict the variability after removal of flaring episodes from the light curves as described in the text.
Current usage metrics show cumulative count of Article Views (full-text article views including HTML views, PDF and ePub downloads, according to the available data) and Abstracts Views on Vision4Press platform.
Data correspond to usage on the plateform after 2015. The current usage metrics is available 48-96 hours after online publication and is updated daily on week days.
Initial download of the metrics may take a while.