Free Access
Fig. 6
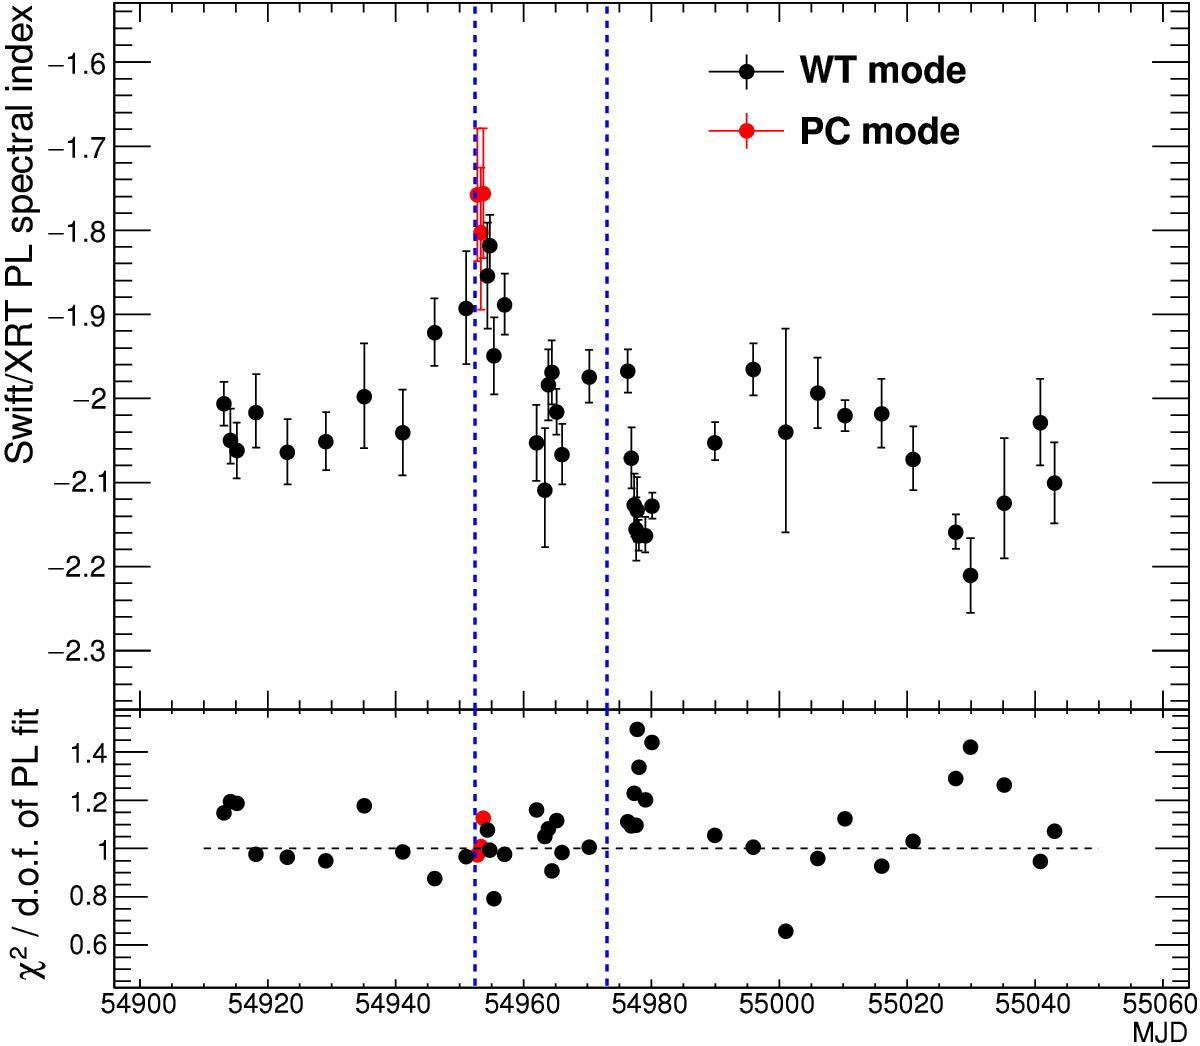
Upper panel: spectral index obtained from a power-law fit to the Swift/XRT spectra vs. observation date. Lower panel: reduced χ2 of the power-law fit to the X-ray spectra. The two vertical blue lines indicate the location of the two VHE γ-ray flares at MJD 54 952 and MJD 54 973 that are discussed in Sects. 4.2 and 4.3.
Current usage metrics show cumulative count of Article Views (full-text article views including HTML views, PDF and ePub downloads, according to the available data) and Abstracts Views on Vision4Press platform.
Data correspond to usage on the plateform after 2015. The current usage metrics is available 48-96 hours after online publication and is updated daily on week days.
Initial download of the metrics may take a while.