Fig. 15
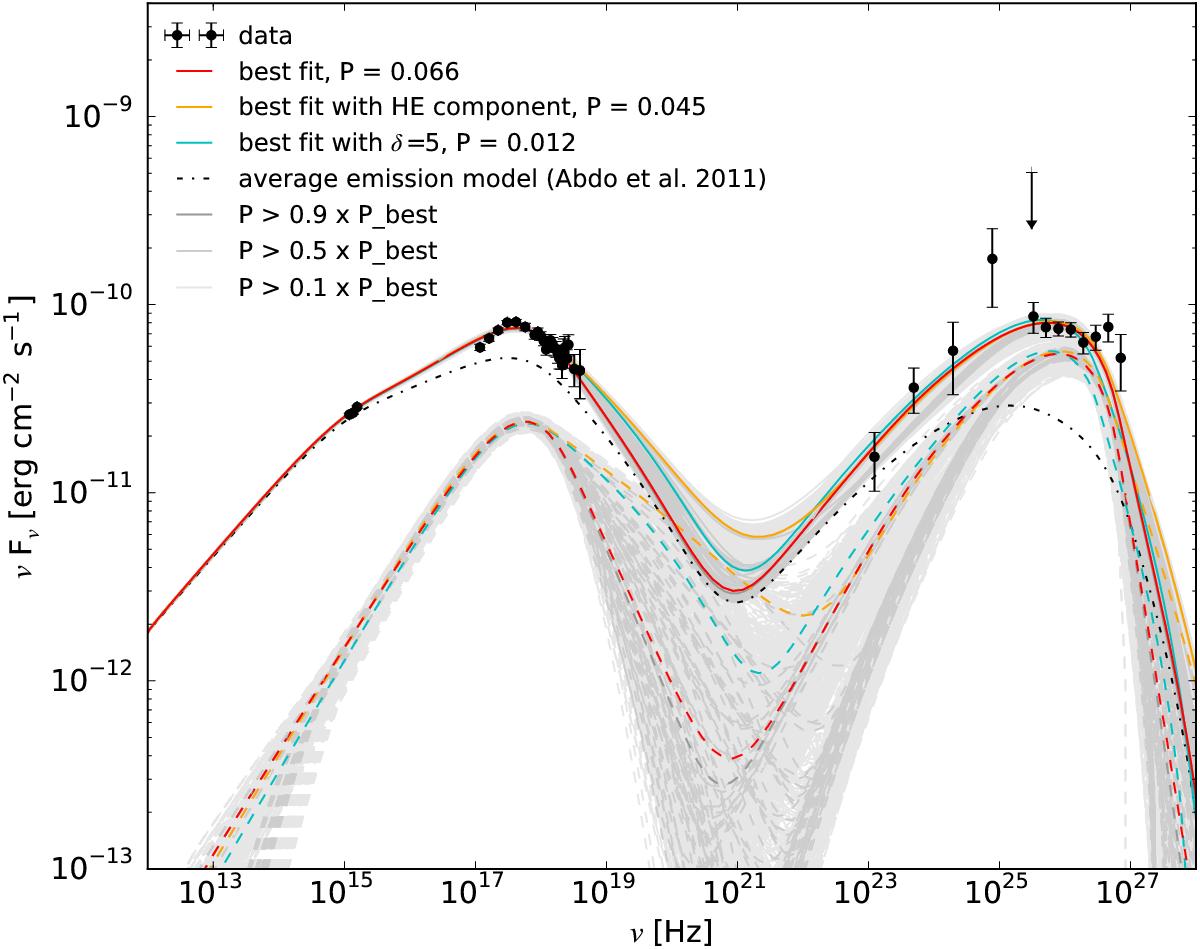
Modelling of the SED of Mrk 501 compiled from measurements collected during the high state observed around MJD 54 973. Two-zone SSC models have been inspected following the grid-scan strategy. The total emission (solid lines) is assumed to stem from a first quiescent region (black dot-dashed lines) responsible for the average state (Abdo et al. 2011a) plus a second emission region (dashed lines). Highlighted are the model with the highest probability of agreement with the data (red), a model featuring a prominent high-energy component in the EED (orange), and a model with low Doppler factor (cyan, δ = 5). Model curves underlaid in grey show the bands spanned by models with a fit probability better than 0.9 × Pbest, 0.5 × Pbest and 0.1 × Pbest, respectively. The data points have been corrected for EBL absorption according to the model by Franceschini et al. (2008).
Current usage metrics show cumulative count of Article Views (full-text article views including HTML views, PDF and ePub downloads, according to the available data) and Abstracts Views on Vision4Press platform.
Data correspond to usage on the plateform after 2015. The current usage metrics is available 48-96 hours after online publication and is updated daily on week days.
Initial download of the metrics may take a while.