Fig. 13
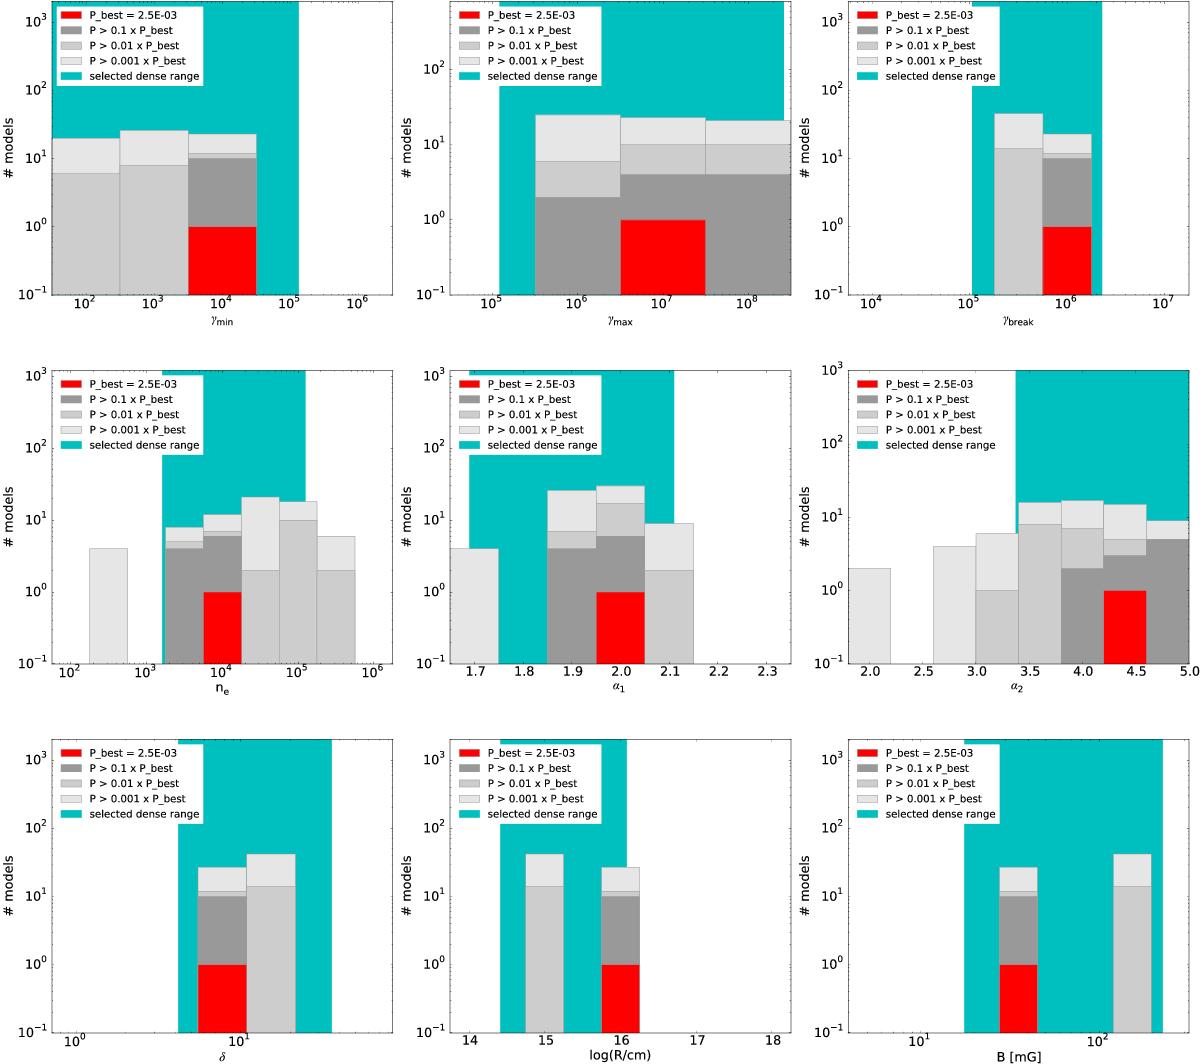
Number of SSC model curves which fulfill the given limits for the fit probability vs. each probed value of each model parameter. Shown are results for the coarse parameter grid-scan within a two-zone scenario for MJD 54 973. The X-axis of each plot spans the probed range for each parameter. Given are the model with the highest probability of agreement with the data and all models within the given probability bands (see legend). The parameter ranges chosen for the dense scan are also shown in each plot.
Current usage metrics show cumulative count of Article Views (full-text article views including HTML views, PDF and ePub downloads, according to the available data) and Abstracts Views on Vision4Press platform.
Data correspond to usage on the plateform after 2015. The current usage metrics is available 48-96 hours after online publication and is updated daily on week days.
Initial download of the metrics may take a while.