Fig. 10
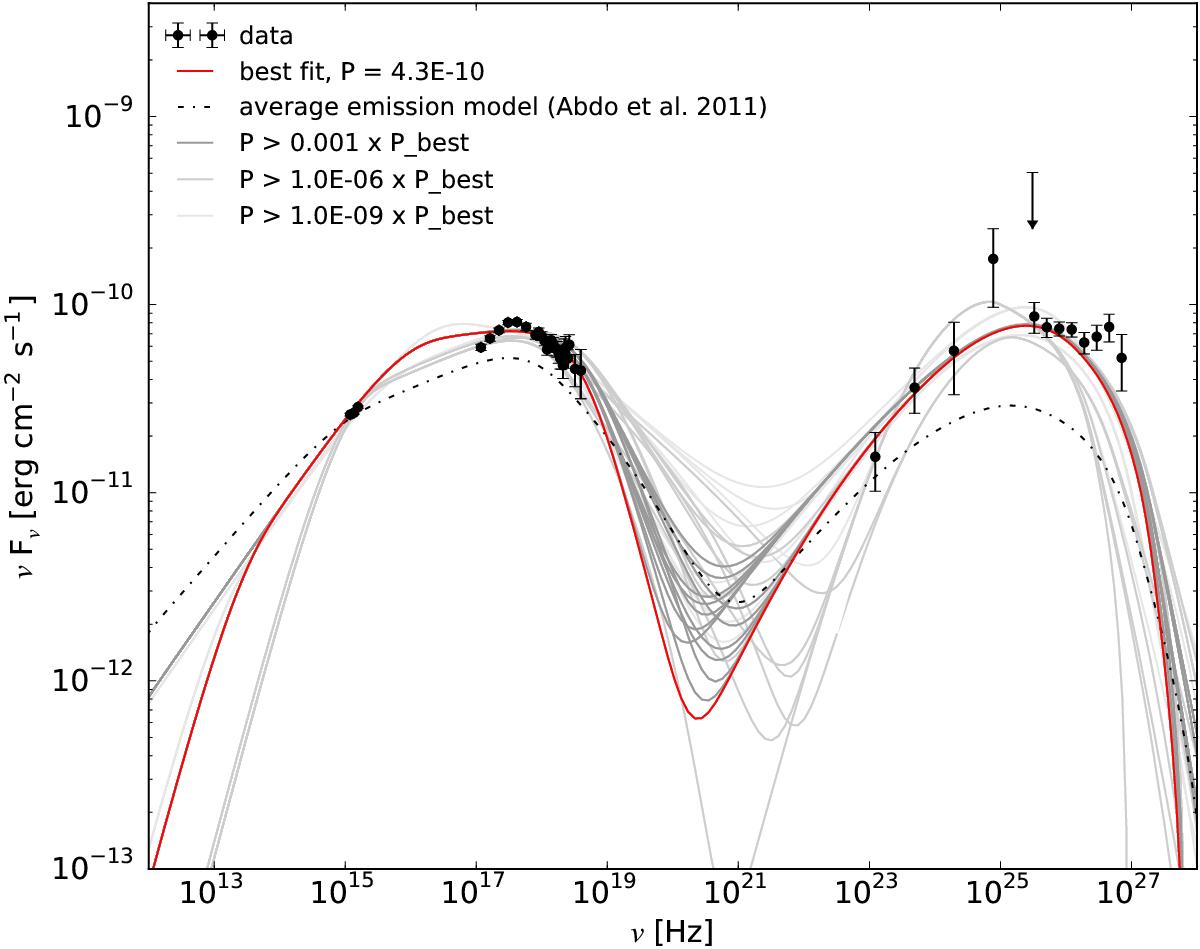
SED grid-scan modeling results for the flaring episode around MJD 54 973 in the scope of a one-zone SSC scenario. Shown are the model curve (red solid line) with the highest probability of agreement with the data as well as model curves within different probability bands. For comparison, the SSC one-zone model found to describe the average state (Abdo et al. 2011a) is also given (black dash-dotted line). Data points have been corrected for EBL absorption according to the model by Franceschini et al. (2008).
Current usage metrics show cumulative count of Article Views (full-text article views including HTML views, PDF and ePub downloads, according to the available data) and Abstracts Views on Vision4Press platform.
Data correspond to usage on the plateform after 2015. The current usage metrics is available 48-96 hours after online publication and is updated daily on week days.
Initial download of the metrics may take a while.