Fig. 9
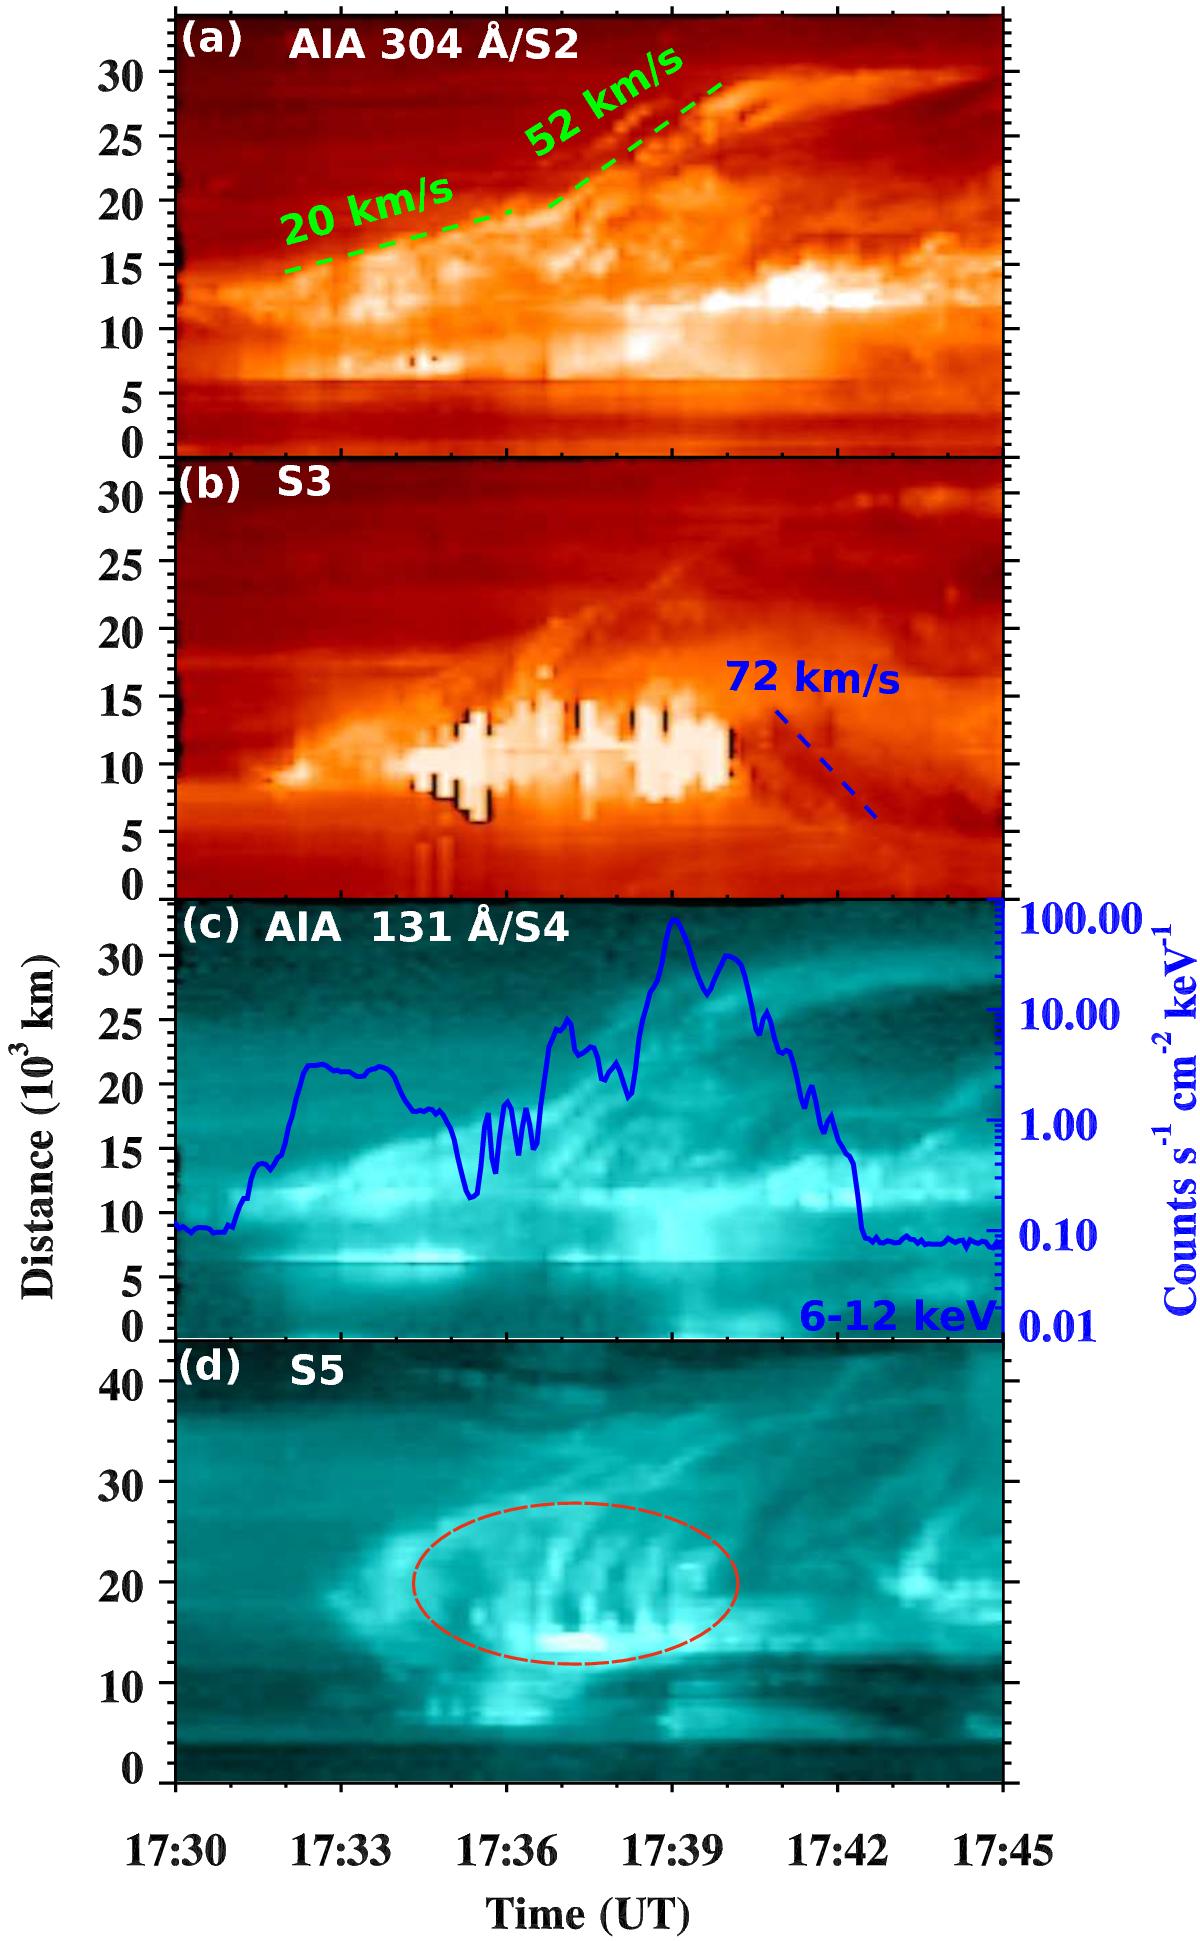
Stack plots along the slices S2, S3, S4, and S5 using AIA 304 and 131 Å images. The Fermi GBM X-ray flux in the 6–12 keV channel is also included in panel c). The periodic rise of multiple reconnected loops is shown within a dashed ellipse (panel d)). The cotemporal X-ray bursts (panel c)) and strong chromospheric brightening in the AIA 304 Å channel (panel b)) indicate the particle acceleration and precipitation during the periodic rise of reconnecting loops.
Current usage metrics show cumulative count of Article Views (full-text article views including HTML views, PDF and ePub downloads, according to the available data) and Abstracts Views on Vision4Press platform.
Data correspond to usage on the plateform after 2015. The current usage metrics is available 48-96 hours after online publication and is updated daily on week days.
Initial download of the metrics may take a while.