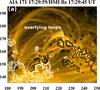
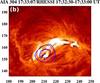
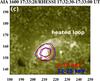
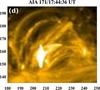
Fig. 8

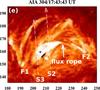
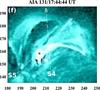
a) AIA 171 Å image with HMI magnetogram contours of positive (white) and negative (black) polarities. The contour levels are ±200 and ±500 gauss. b)–c) RHESSI X-ray contours (red: 6–12 keV, blue: 12–25 keV) overlaid on the AIA 304 and 1600 Å images. The contour levels are 85% and 95% of the peak intensity. d)–f) Observation of the flux rope in different AIA channels (304, 171, and 131 Å). S2, S3, S4, and S5 are the slices used to create the stack plots. F1 and F2 are the new footpoints of the flux rope. The oscillatory reconnection and associated flux rope formation with counterclockwise rotation is shown by a composite movie (AIA 171, 304, and 131 Å, bottom panels) available online.
Current usage metrics show cumulative count of Article Views (full-text article views including HTML views, PDF and ePub downloads, according to the available data) and Abstracts Views on Vision4Press platform.
Data correspond to usage on the plateform after 2015. The current usage metrics is available 48-96 hours after online publication and is updated daily on week days.
Initial download of the metrics may take a while.