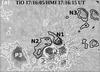
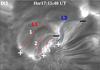
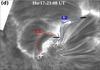
Fig. 6

a) NST TiO (7057 Å) image overlaid by HMI magnetogram contours of positive (white) and negative (black) polarities. The contour levels are ±200 and ±500 gauss. b)–d) NST Hα+0.8 Å and Hα line center images showing two loop systems (L1 and L2) and their connectivity (marked by plus and minus signs). The size of each image a)–d) is ~50′′× 35″. Each division on the x- and y-axes is equal to 1″.

Current usage metrics show cumulative count of Article Views (full-text article views including HTML views, PDF and ePub downloads, according to the available data) and Abstracts Views on Vision4Press platform.
Data correspond to usage on the plateform after 2015. The current usage metrics is available 48-96 hours after online publication and is updated daily on week days.
Initial download of the metrics may take a while.