Fig. 12
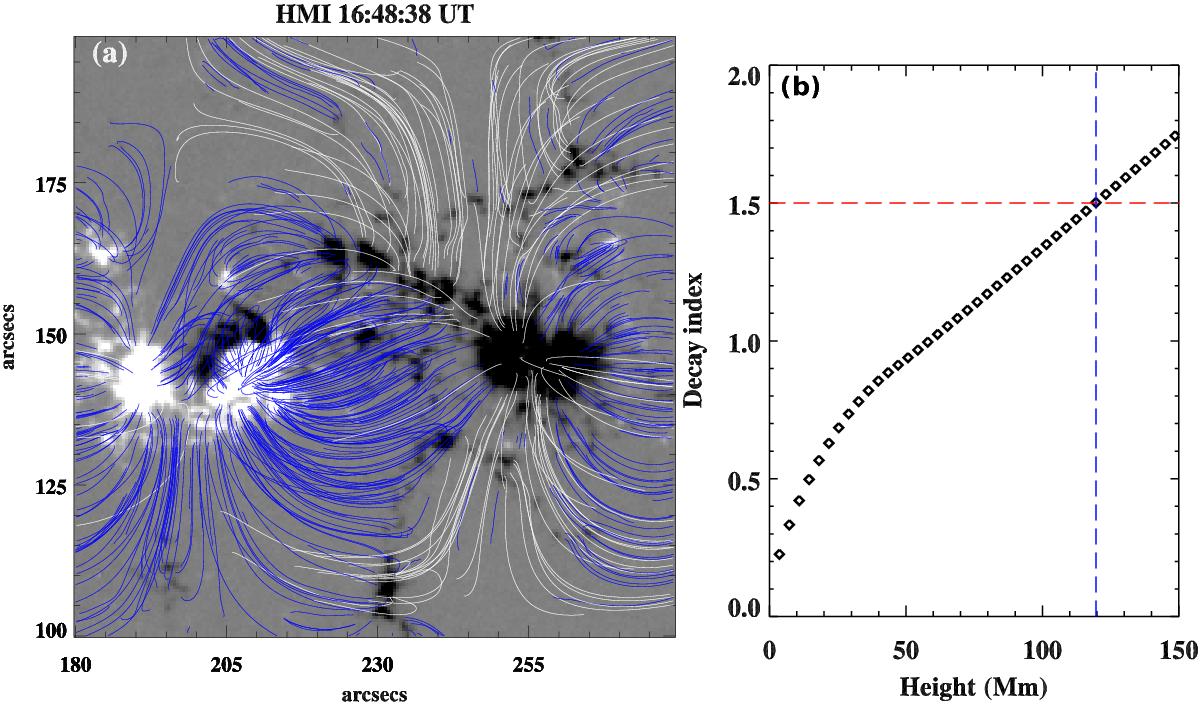
a) Potential field extrapolation of the AR using HMI magnetogram at 16:48:38 UT. The closed and open field lines are shown in blue and white, respectively. b) Variation of the decay index with respect to height (Mm) above the PIL. The red horizontal dashed line indicates the threshold value of the decay index (1.5) at a height of ~120 Mm (blue vertical dashed line).
Current usage metrics show cumulative count of Article Views (full-text article views including HTML views, PDF and ePub downloads, according to the available data) and Abstracts Views on Vision4Press platform.
Data correspond to usage on the plateform after 2015. The current usage metrics is available 48-96 hours after online publication and is updated daily on week days.
Initial download of the metrics may take a while.