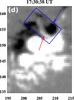
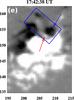
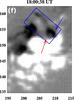
Fig. 10
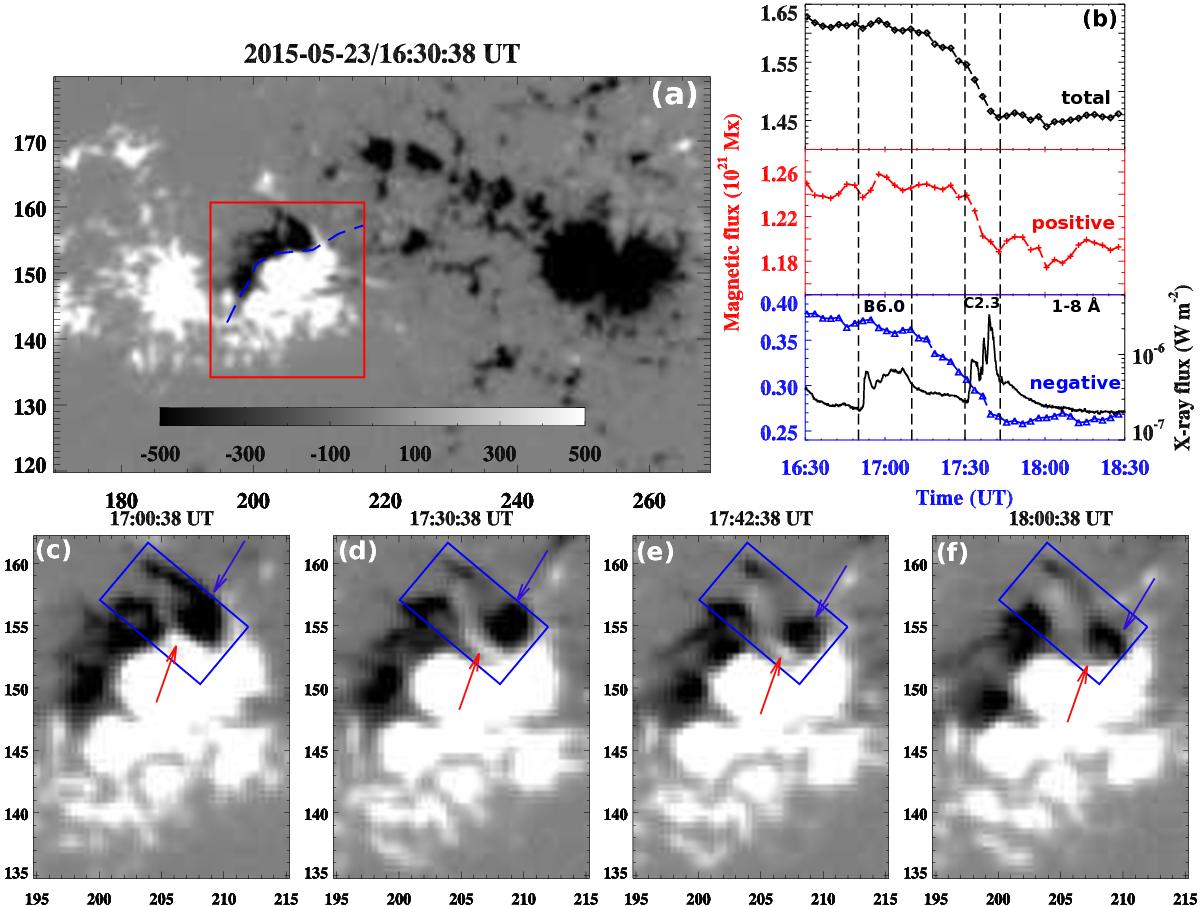
a) HMI magnetogram of AR NOAA 12353. b) Positive (red), absolute negative (blue), and total (black) flux profiles extracted from the rectangular box (red) region shown in the left panel. The GOES soft X-ray flux profile in 1–8 Å channel is also plotted with negative flux profile. The vertical dashed lines indicate the B6.0 and C2.3 flare durations. c)–f) Selected HMI magnetograms of the flare site showing flux cancellation (within blue rectangular box). The x- and y-axes are labeled in arcsecs. The shear motion and rapid flux cancellation between N1 and P1 is shown in the HMI magnetograms movie (bottom panels) available online.
Current usage metrics show cumulative count of Article Views (full-text article views including HTML views, PDF and ePub downloads, according to the available data) and Abstracts Views on Vision4Press platform.
Data correspond to usage on the plateform after 2015. The current usage metrics is available 48-96 hours after online publication and is updated daily on week days.
Initial download of the metrics may take a while.