Free Access
Fig. 4
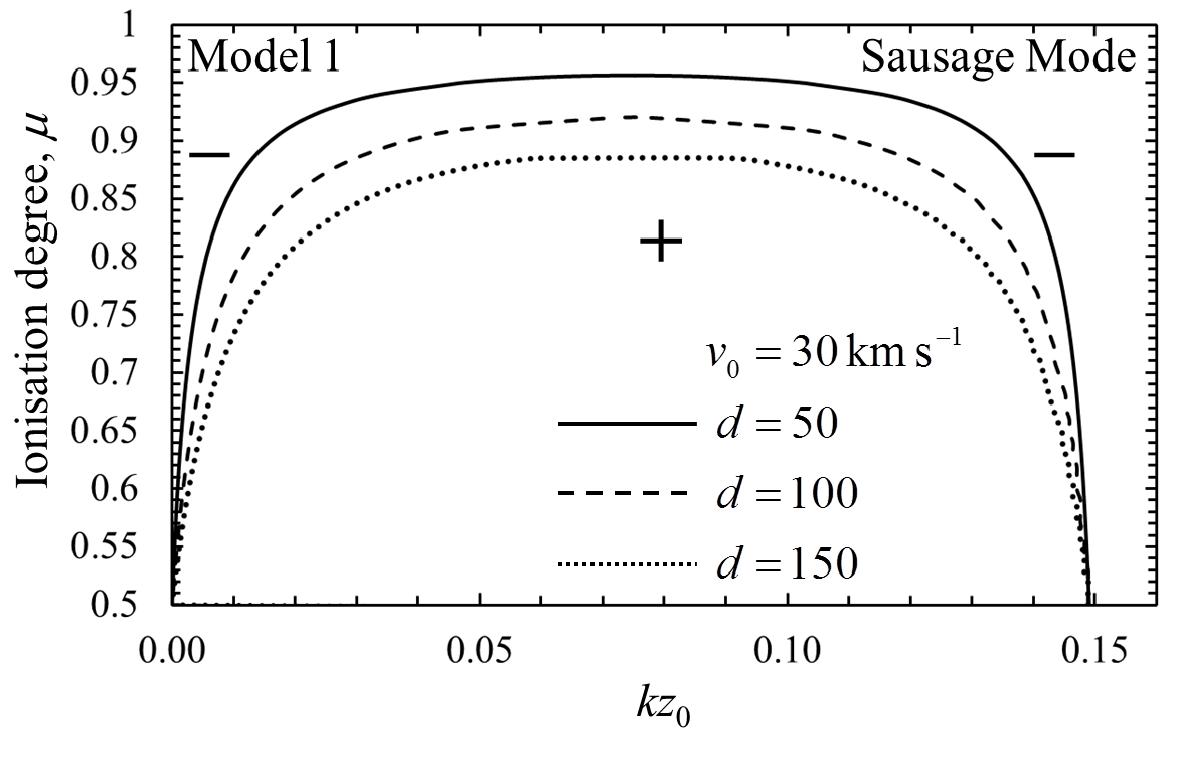
Contour plot of the variation of ωi1 in the case of sausage modes in terms of ionisation degree and the value of the dimensionless parameter kz0 for model 1. Here v0 = 30 km s-1. The region where instability occurs is shown by the plus symbol.
Current usage metrics show cumulative count of Article Views (full-text article views including HTML views, PDF and ePub downloads, according to the available data) and Abstracts Views on Vision4Press platform.
Data correspond to usage on the plateform after 2015. The current usage metrics is available 48-96 hours after online publication and is updated daily on week days.
Initial download of the metrics may take a while.