Fig. 3
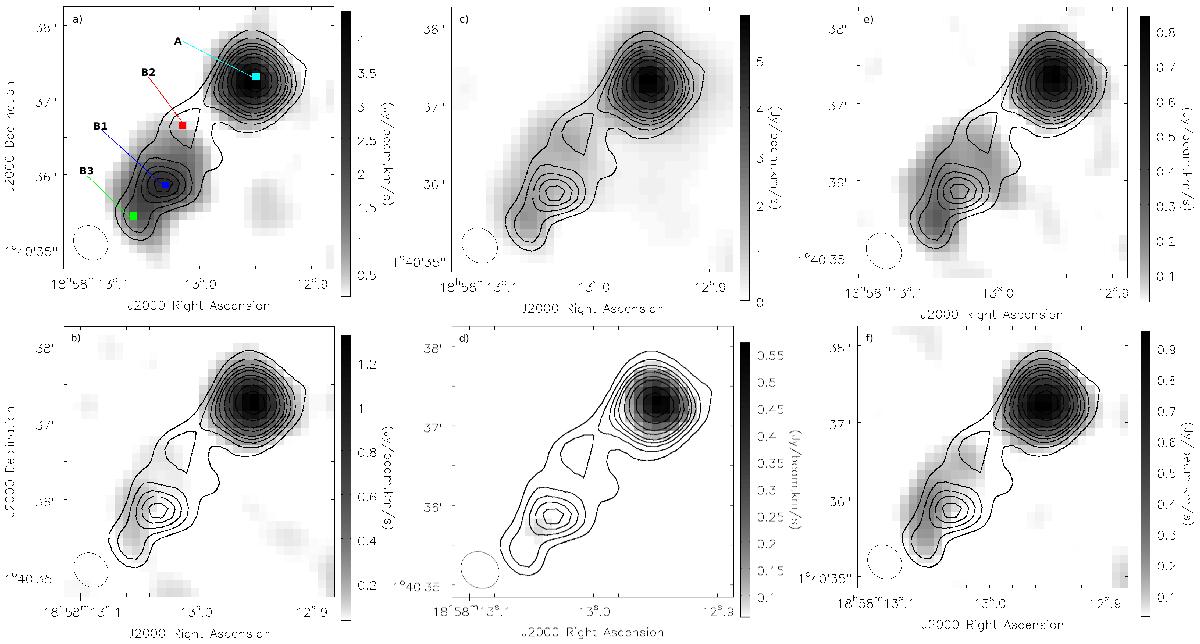
Integrated intensity maps of six species across G35.20, where the contours are the 870 μm continuum with the same levels as Fig. 1. Panel a) shows the CH3OCHO ν = 0 emission at 336.086 GHz integrated from 18.5 to 38 km s-1. Panel b) shows the CH3OCHO ν = 1 emission at 348.084 GHz integrated from 26 to 38.5 km s-1. Panel c) shows the H2CS emission at 338.083 GHz integrated from 24.5 to 38.5 km s-1. Panel d) shows ethylene glycol ((CH2OH)2) emission at 335.030 GHz integrated from 25–36.5 km s-1. Panel e) shows CH3CHO ν = 0 emission at 335.318 GHz integrated from 22.5 to 37 km s-1. Panel f) shows CH3CHO ν = 2 emission at 349.752 GHz integrated from 24 to 29 km s-1. It can clearly be seen between panels a) and b) and between e) and f) that vibrationally excited states have a much smaller emitting region. It is also clear in panel d) that (CH2OH)2 is only seen in core A.
Current usage metrics show cumulative count of Article Views (full-text article views including HTML views, PDF and ePub downloads, according to the available data) and Abstracts Views on Vision4Press platform.
Data correspond to usage on the plateform after 2015. The current usage metrics is available 48-96 hours after online publication and is updated daily on week days.
Initial download of the metrics may take a while.