Free Access
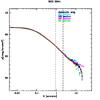
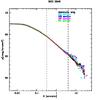
Fig. B.1
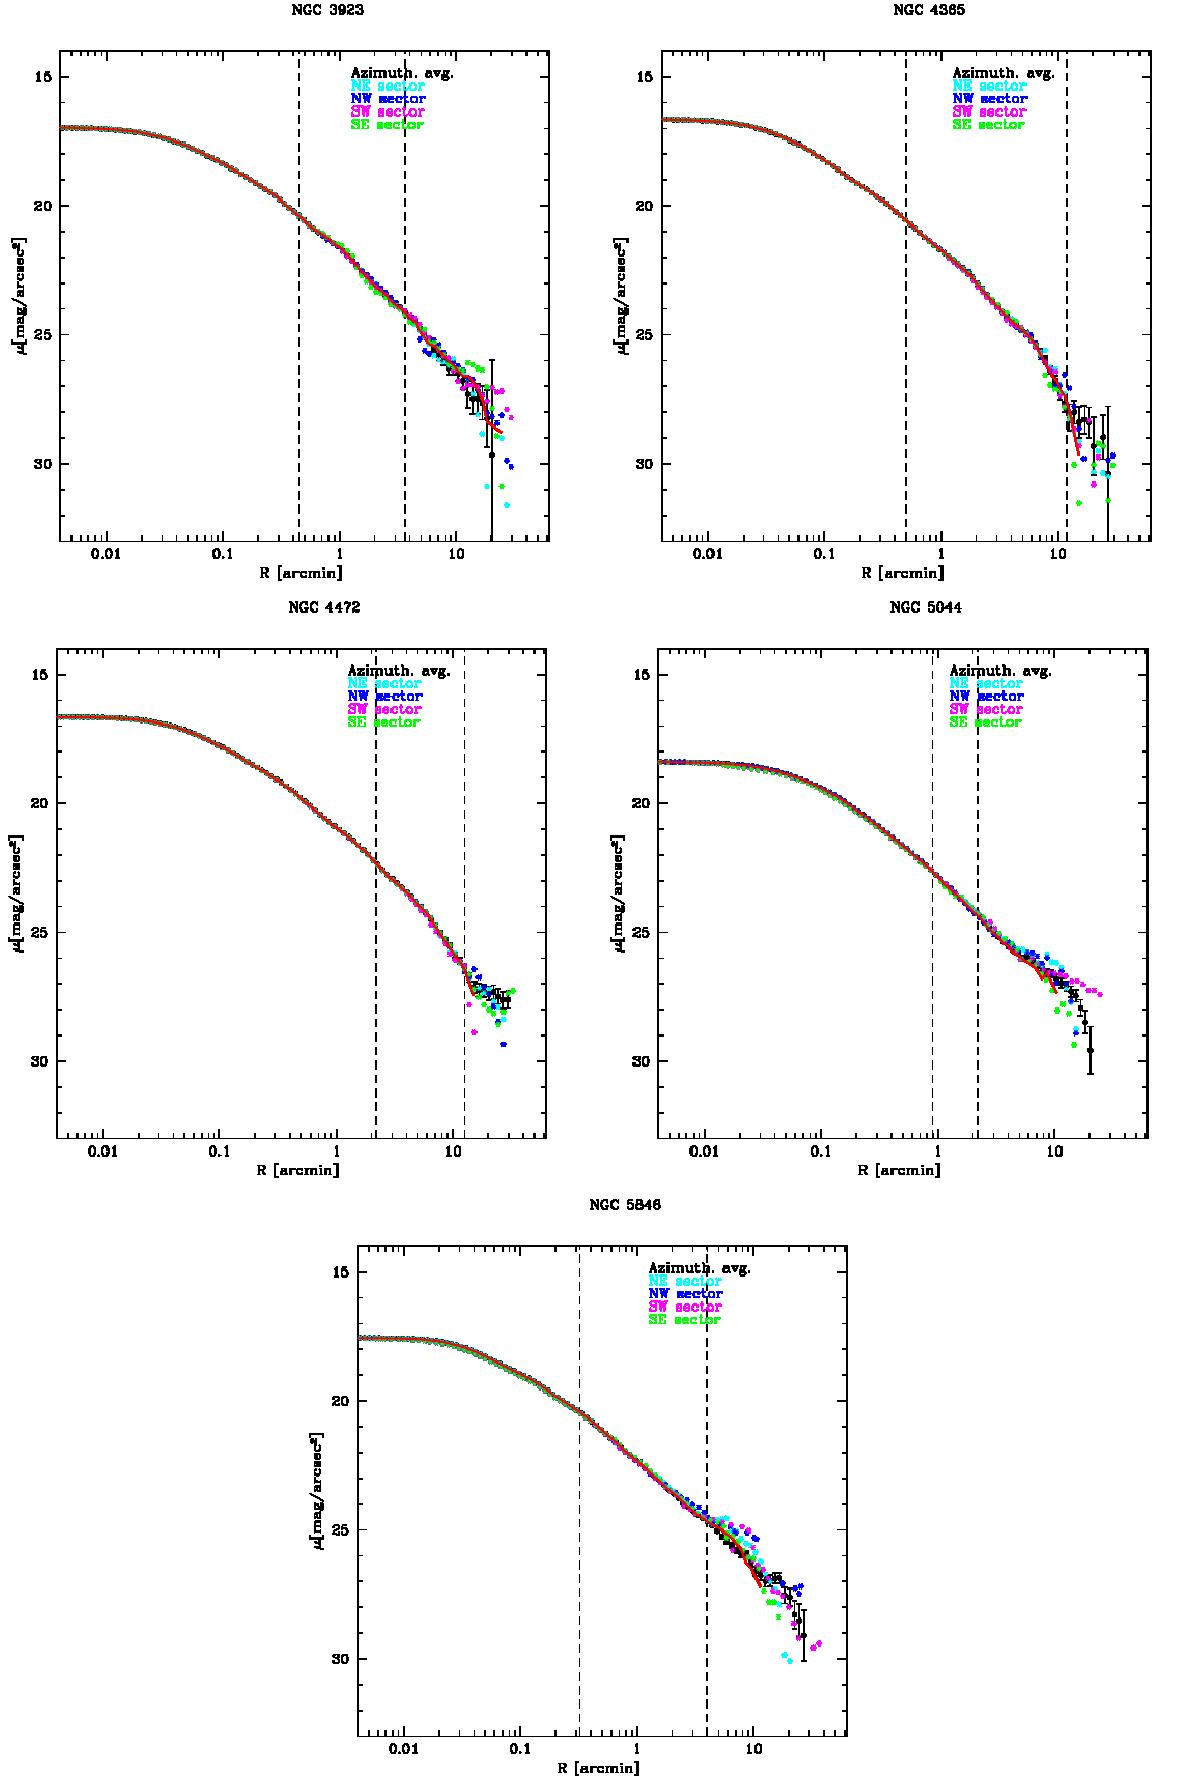
VST g-band surface brightness profiles of NGC 3923, NGC 4365, NGC 4472, NGC 5044, and NGC 5846, extracted in azimuthal sectors and compared with the azimuthally averaged profile. The red line is the average profile, while the dashed lines indicate the location of the transition radii.
This figure is made of several images, please see below:
Current usage metrics show cumulative count of Article Views (full-text article views including HTML views, PDF and ePub downloads, according to the available data) and Abstracts Views on Vision4Press platform.
Data correspond to usage on the plateform after 2015. The current usage metrics is available 48-96 hours after online publication and is updated daily on week days.
Initial download of the metrics may take a while.