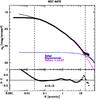
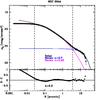
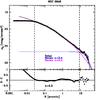
Fig. D.7
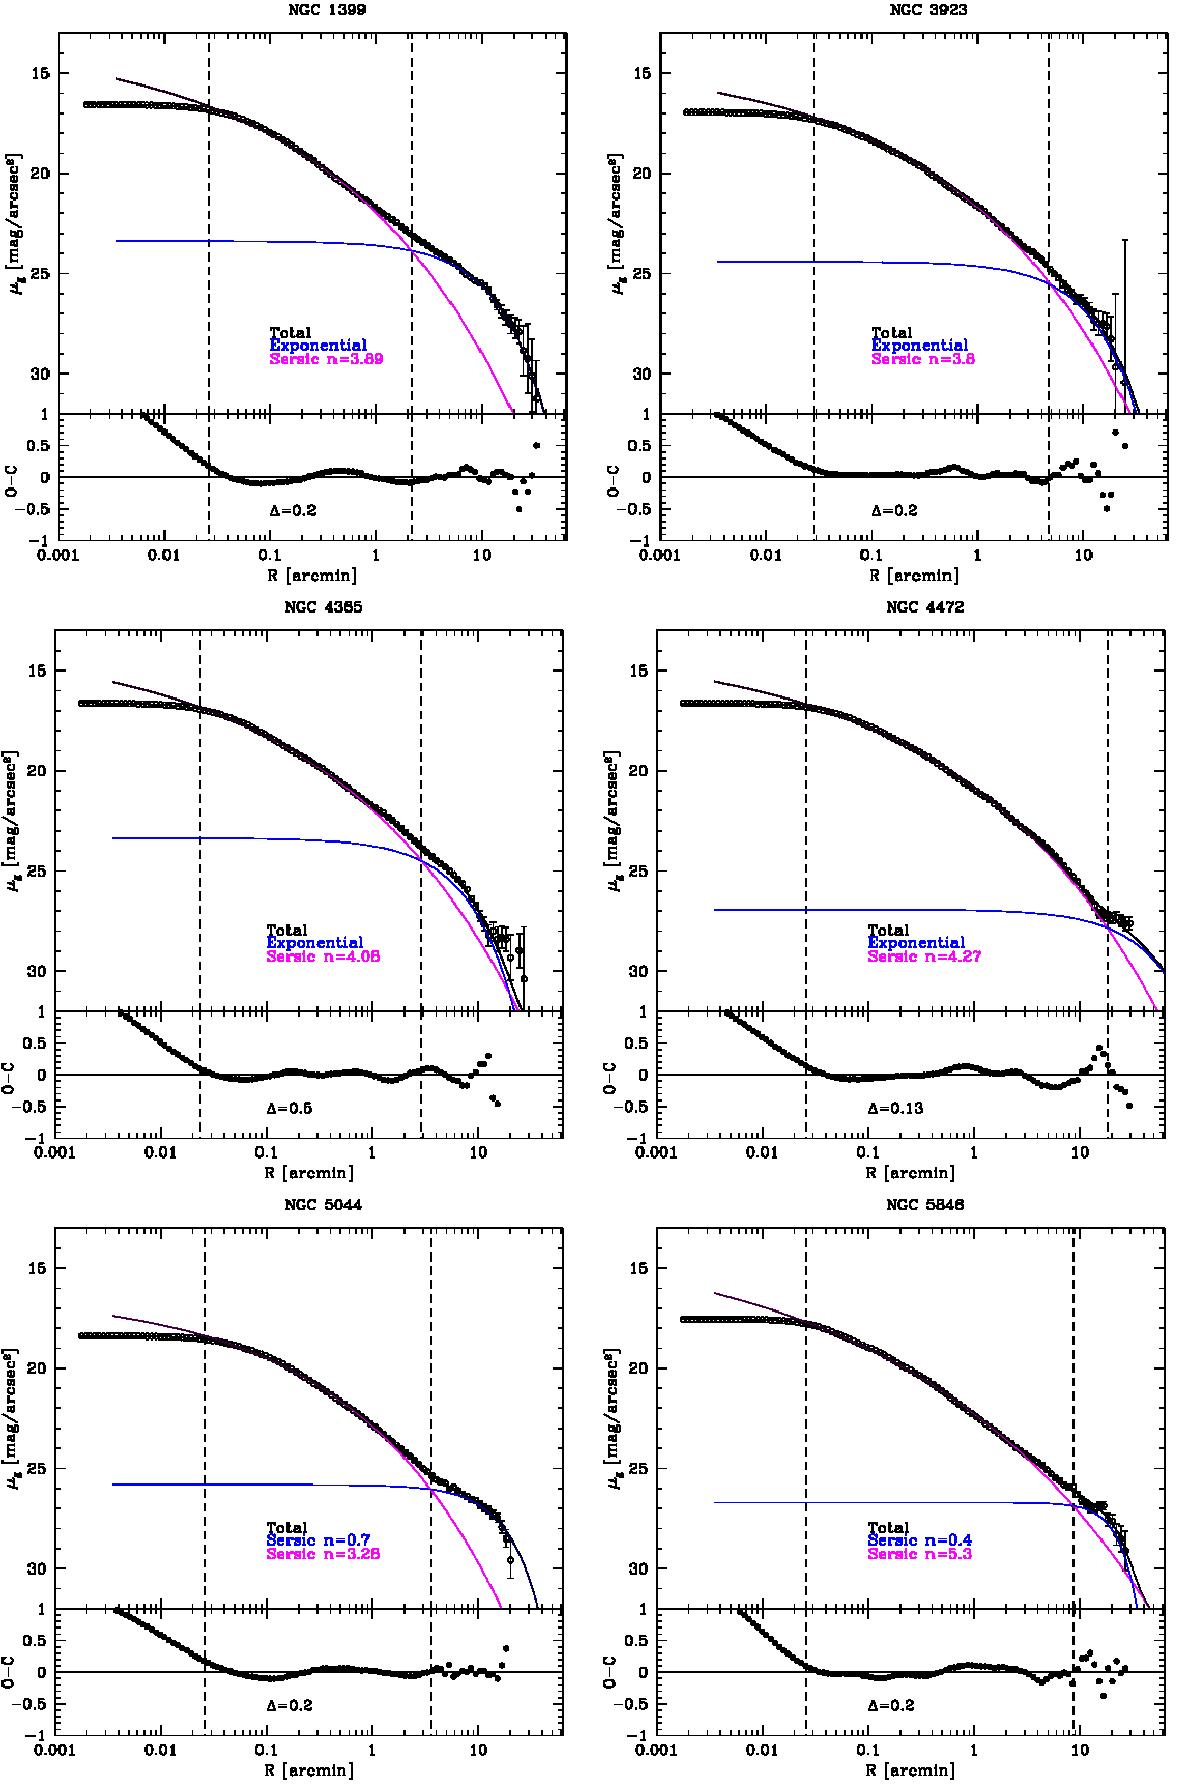
VST g-band profiles of NGC 1399, NGC 3923, NGC 4365, NGC 4472, NGC 5044, and NGC 5846 plotted on a logarithmic scale. The blue line is a fit to the outer regions with an exponential component, for NGC 1399, NGC 3923, NGC 4365, and NGC 4472, and with a Sérsic component for NGC 5044 and NGC 5846. The magenta line is a fit to the inner regions with a Sérsic profile, and the black line is the sum of the components in each fit. The dashed lines indicate the core of the galaxy (1.5 × FWHM), which was excluded in the fit, and the transition point between the two components, respectively.
Current usage metrics show cumulative count of Article Views (full-text article views including HTML views, PDF and ePub downloads, according to the available data) and Abstracts Views on Vision4Press platform.
Data correspond to usage on the plateform after 2015. The current usage metrics is available 48-96 hours after online publication and is updated daily on week days.
Initial download of the metrics may take a while.