Free Access
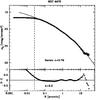
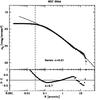
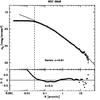
Fig. D.6
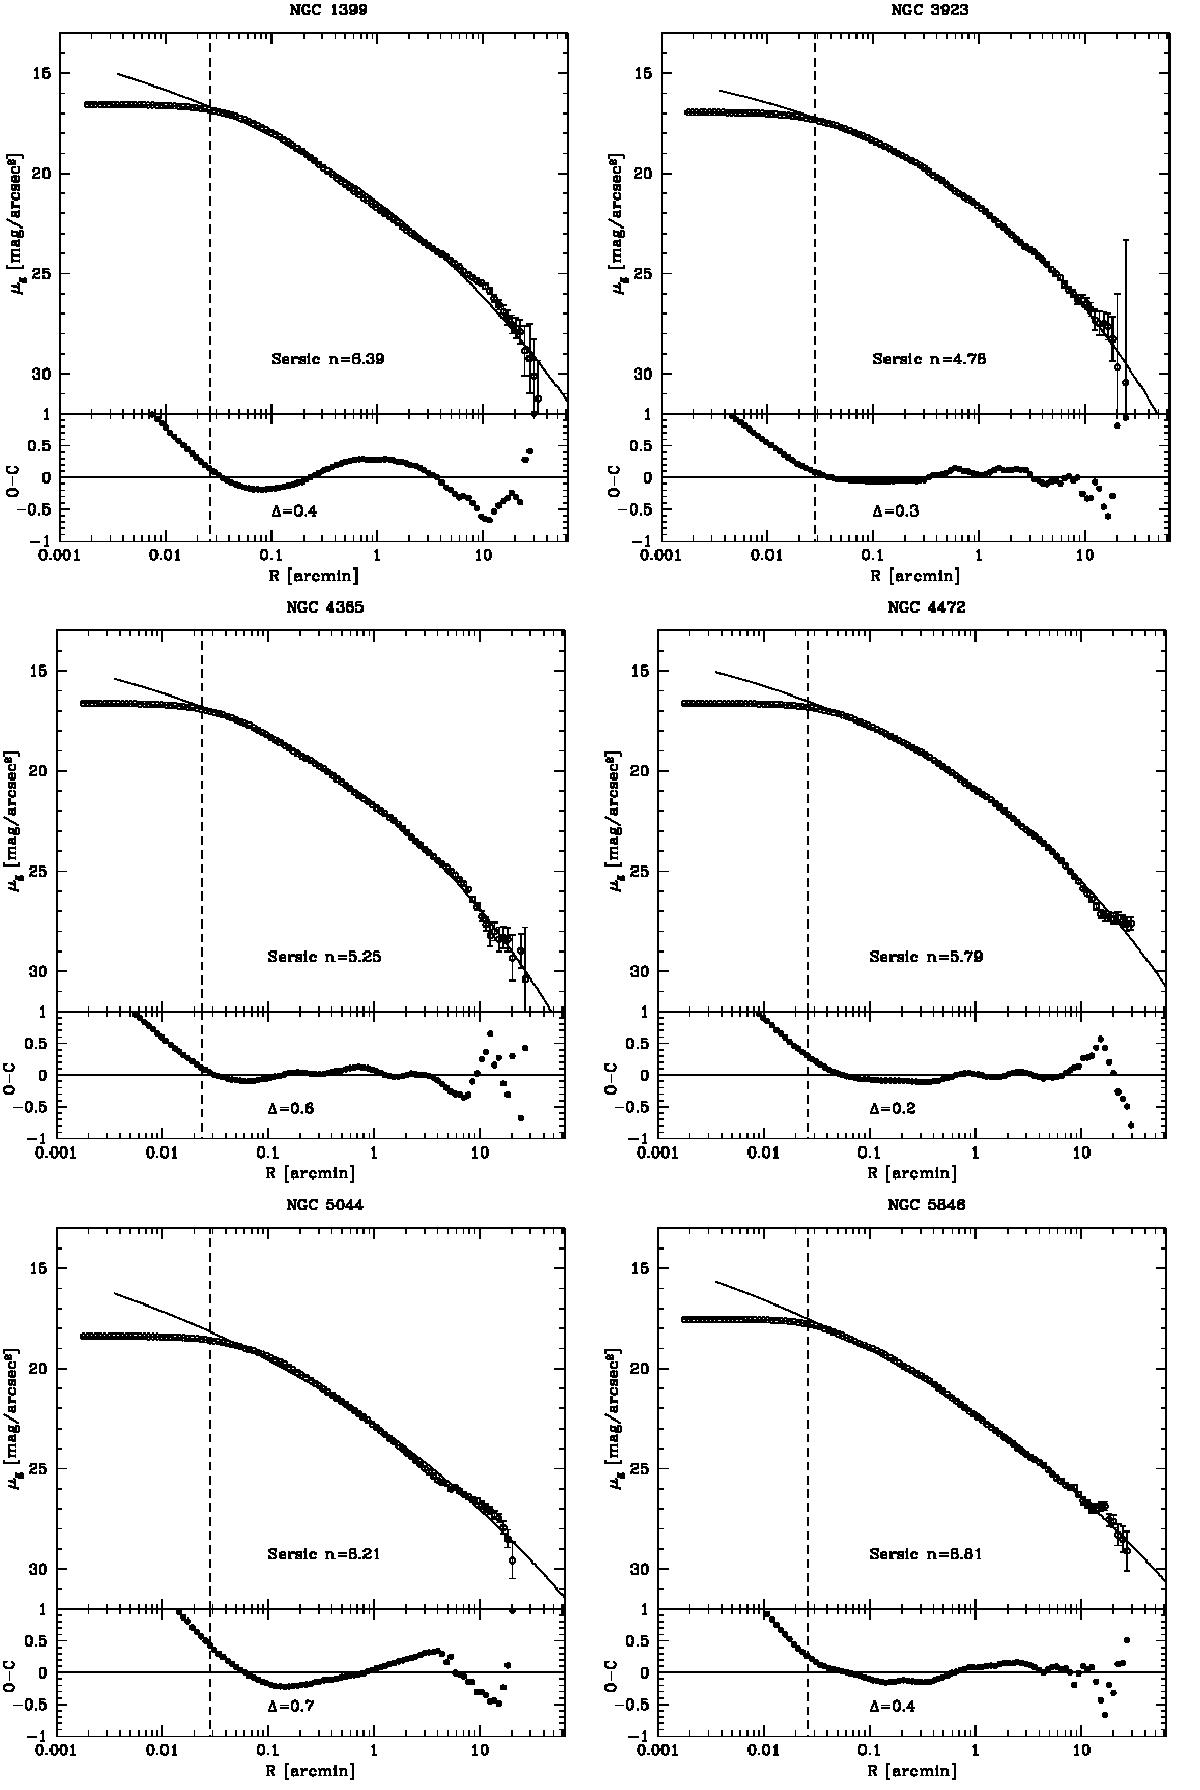
VST g-band profiles of NGC 1399, NGC 3923, NGC 4365, NGC 4472, NGC 5044, and NGC 5846 plotted on a logarithmic scale. The black line is a fit to the surface brightness profiles with a single Sérsic law. The dashed line indicates the core of the galaxy (~ 1.5 × FWHM), which has been excluded in the fit.
This figure is made of several images, please see below:
Current usage metrics show cumulative count of Article Views (full-text article views including HTML views, PDF and ePub downloads, according to the available data) and Abstracts Views on Vision4Press platform.
Data correspond to usage on the plateform after 2015. The current usage metrics is available 48-96 hours after online publication and is updated daily on week days.
Initial download of the metrics may take a while.