Fig. 1
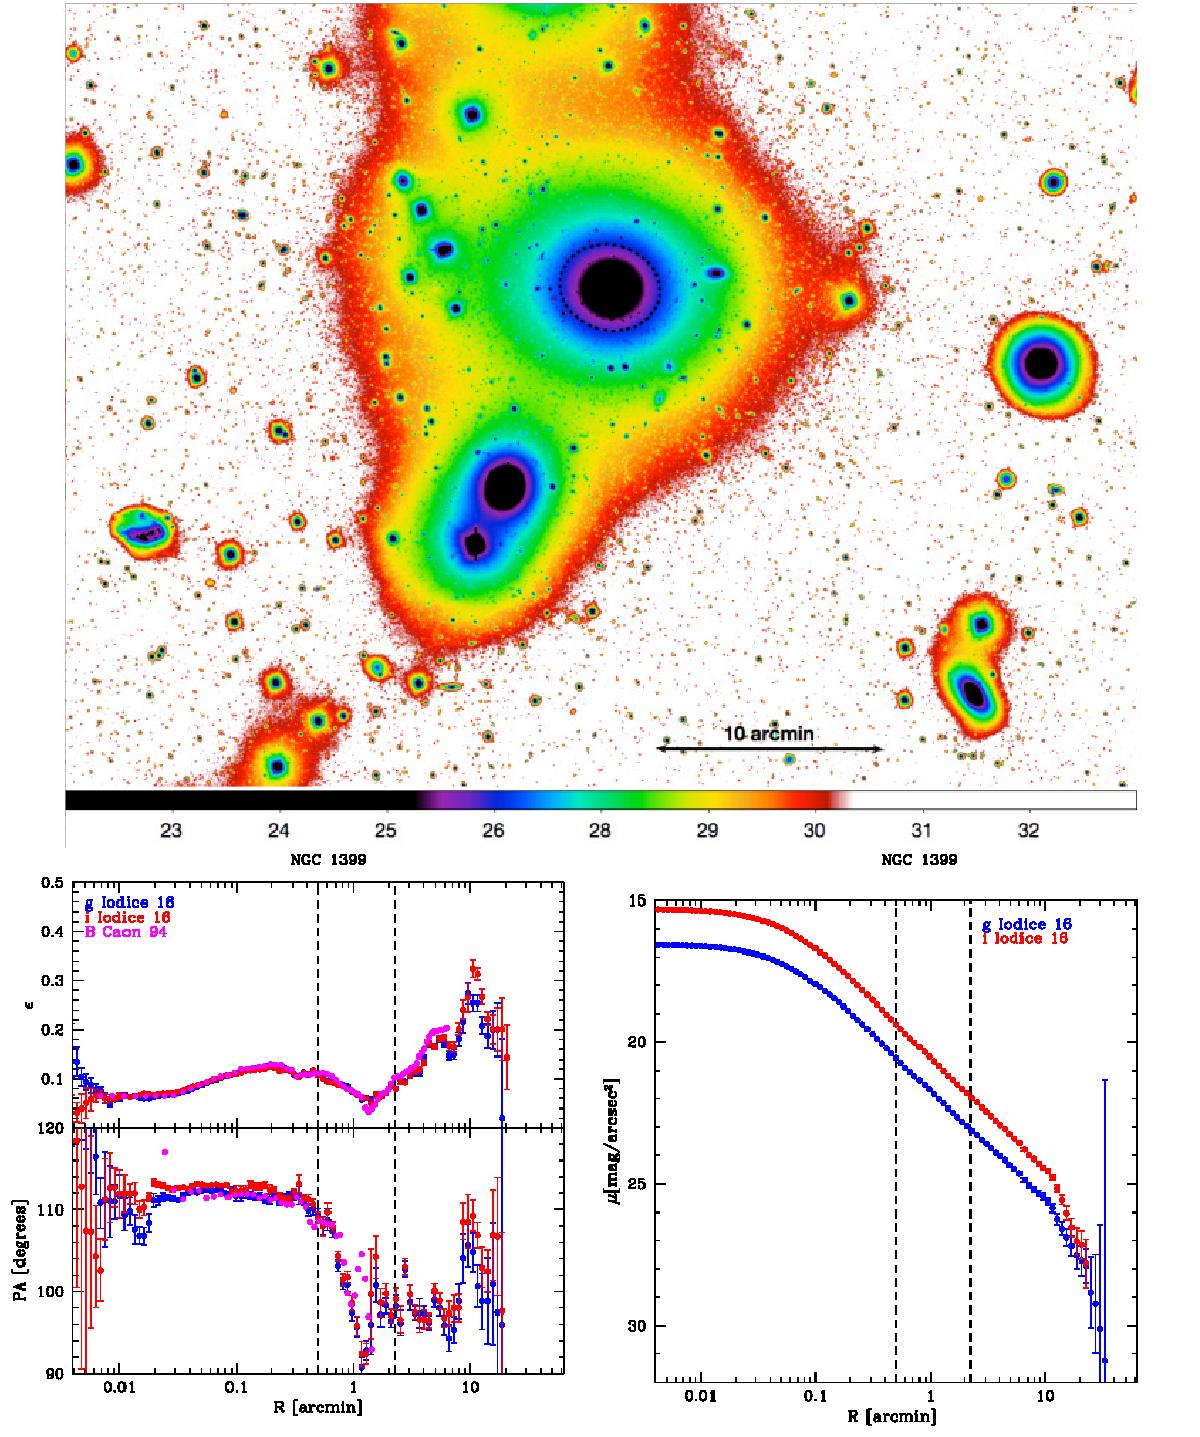
Top: VST g-band sky-subtracted image of the field around NGC 1399. The colour scale represents surface brightness in mag/arcsec2. The dashed black contour indciates the transition radius in the surface brightness profile, defined in Sect. 5. North is up, east is to the left. Bottom left: ellipticity (ϵ) and position angle (PA) profiles for NGC 1399, in the g band (blue points) and i band (red points). Bottom right: azimuthally averaged surface brightness profiles in the g (blue) and i (red) bands. The dashed lines indicate the transition radii in the surface brightness profile, listed in Table 6, which represents the location of the transition between two fit conponents, as described in Sect. 5.
Current usage metrics show cumulative count of Article Views (full-text article views including HTML views, PDF and ePub downloads, according to the available data) and Abstracts Views on Vision4Press platform.
Data correspond to usage on the plateform after 2015. The current usage metrics is available 48-96 hours after online publication and is updated daily on week days.
Initial download of the metrics may take a while.