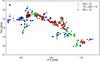
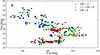
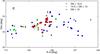
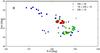
Fig. 1
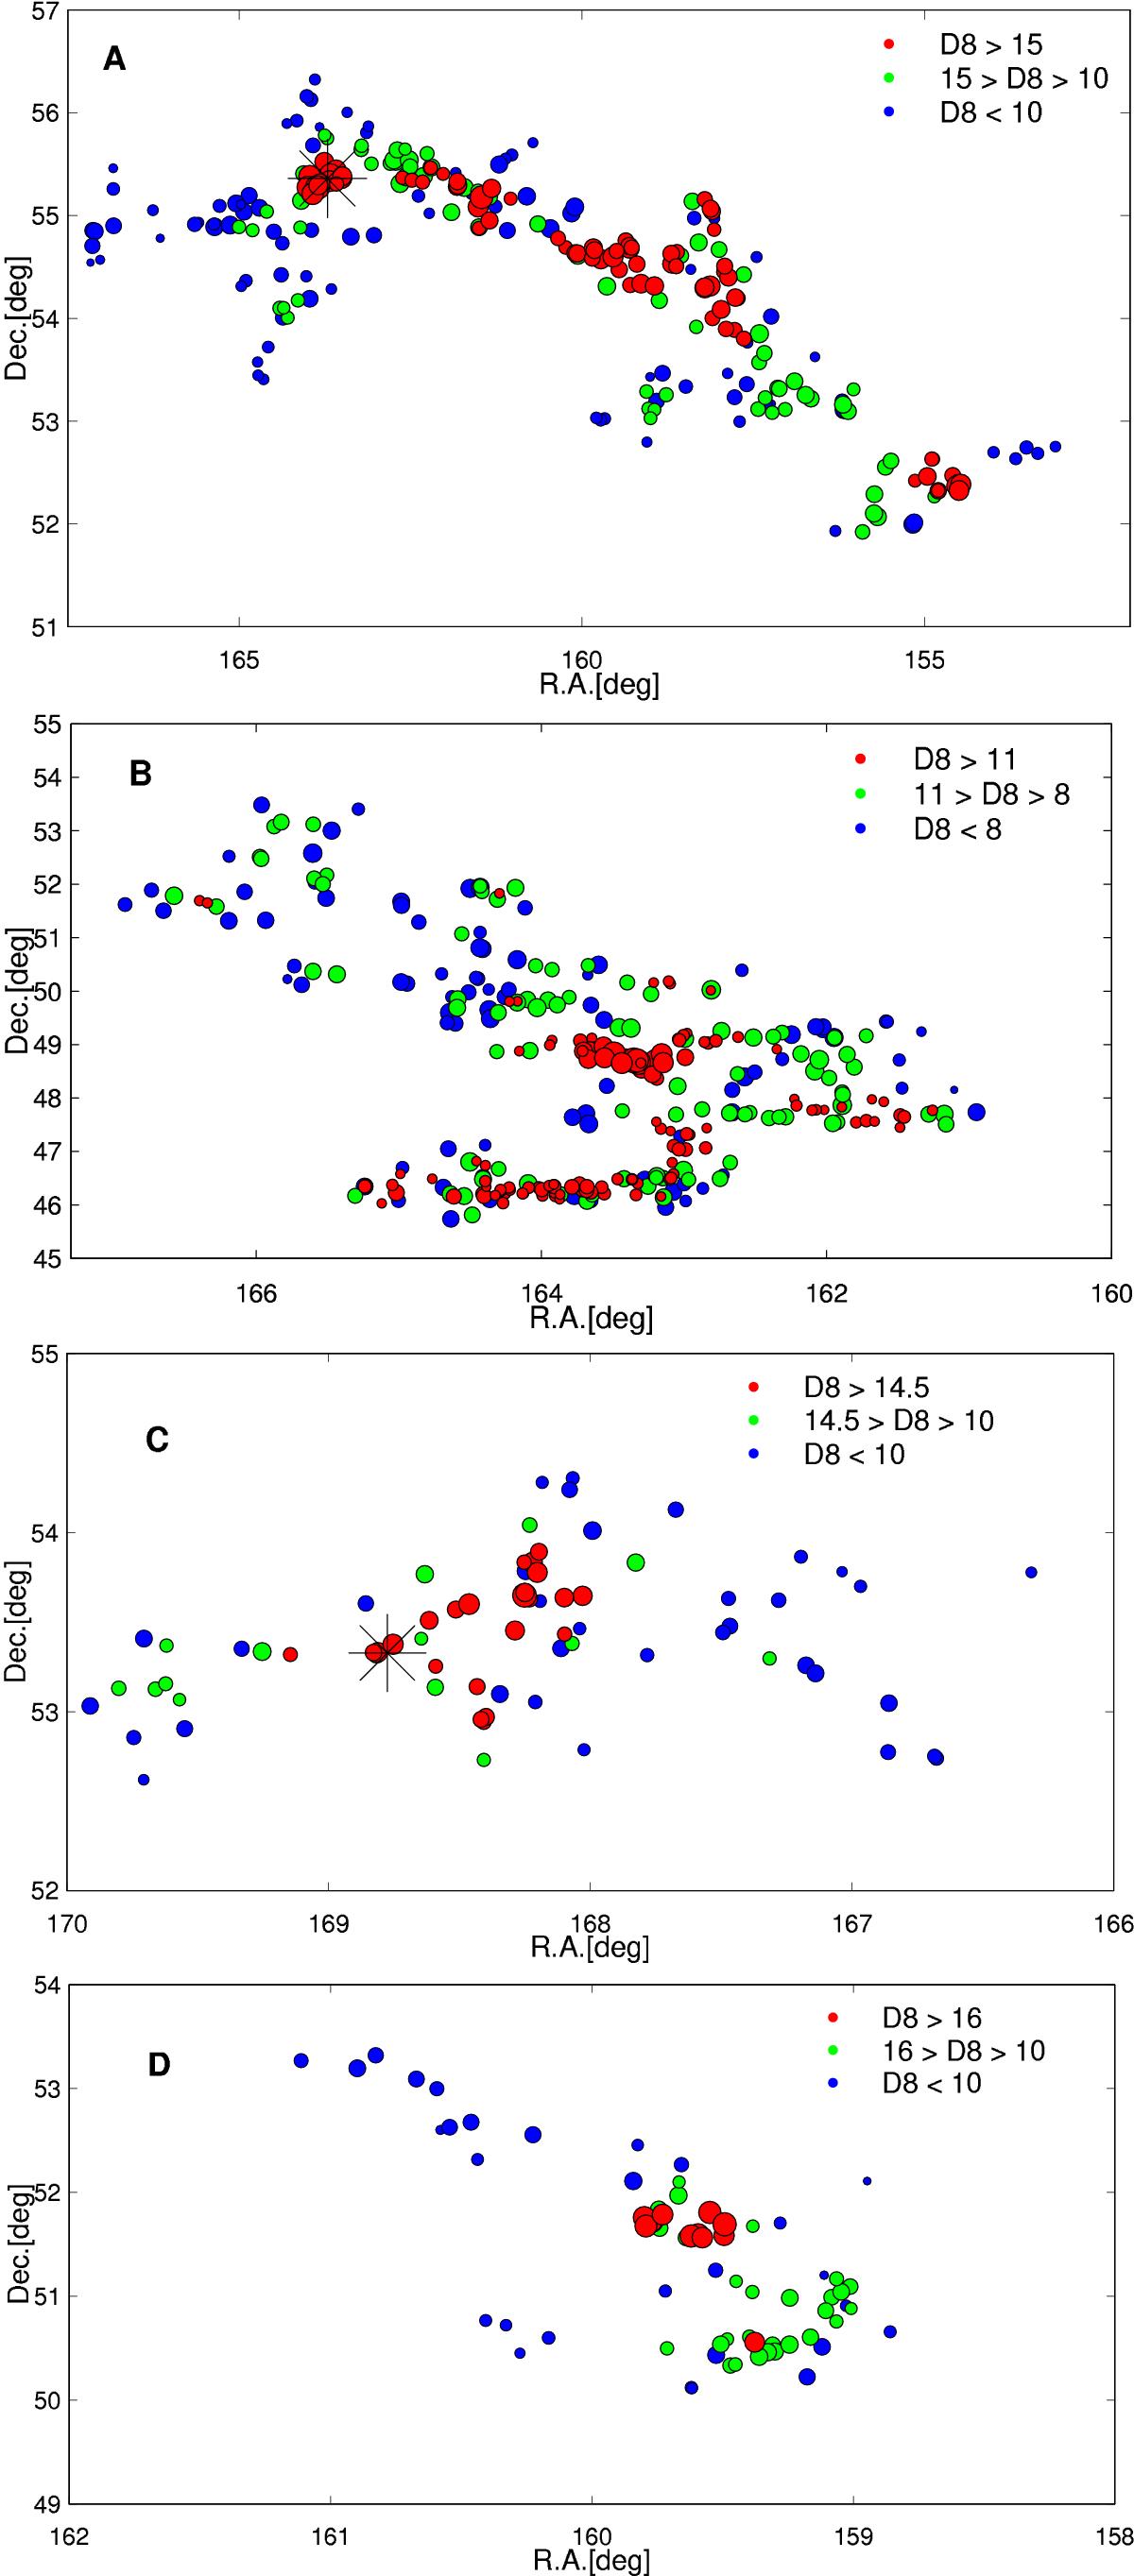
Distribution of galaxies in the BGW superclusters in the sky plane (from up to down: the superclusters A, B, C and D). Red circles denote groups in the regions of the highest global density in each supercluster; green circles correspond to groups with intermediate luminosity density, and blue circles correspond to groups with the lowest luminosity density, as shown in the panels. The density limits are chosen so that each density interval contains approximately one-third of the supercluster galaxies. Symbol sizes are proportional to the value of the density field at the location of a galaxy. The stars in the plots of superclusters A and C denote the location of the Planck clusters PSZ2 G151.62+54.78 (supercluster A), and PSZ2 G150.56+58.32 (supercluster C).
Current usage metrics show cumulative count of Article Views (full-text article views including HTML views, PDF and ePub downloads, according to the available data) and Abstracts Views on Vision4Press platform.
Data correspond to usage on the plateform after 2015. The current usage metrics is available 48-96 hours after online publication and is updated daily on week days.
Initial download of the metrics may take a while.