Fig. 1
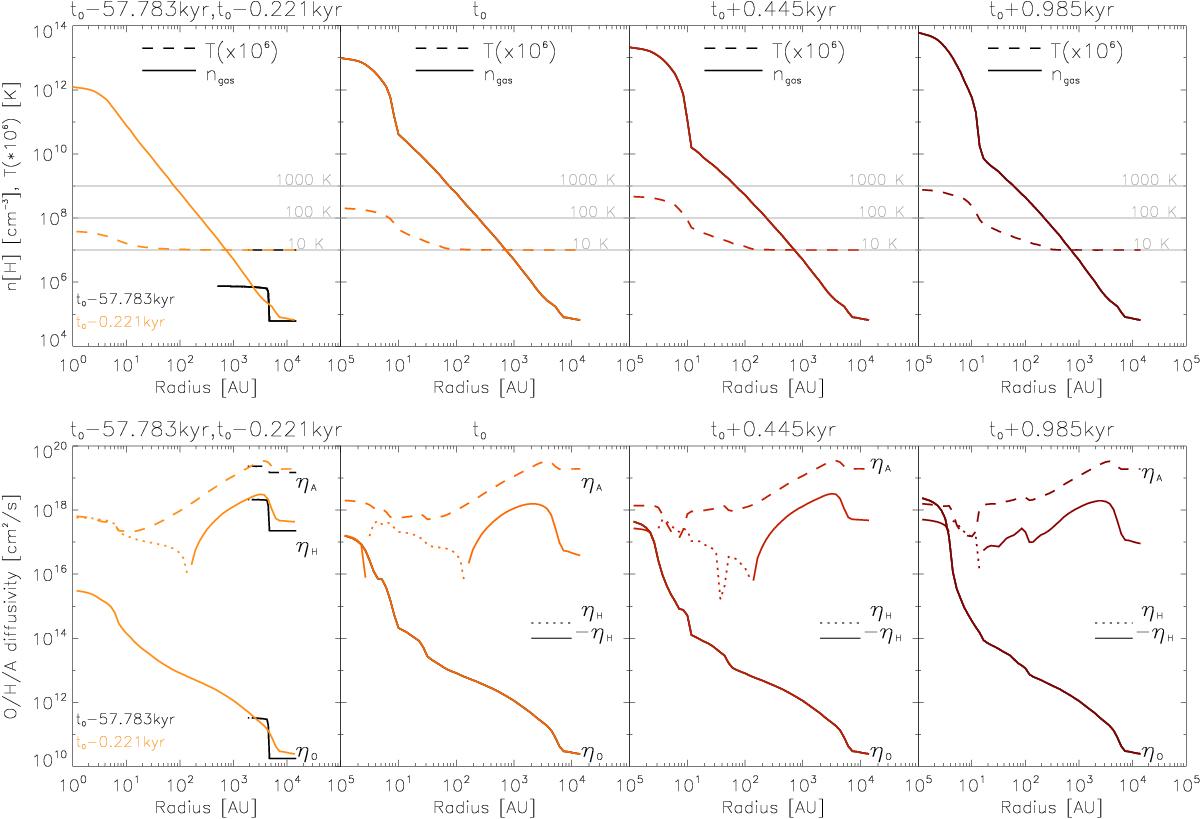
Time evolution of gas density, temperature, and magnetic diffusivities in the fiducial collapse model, shown for five snapshots. Left plots: both the initial condition (in black) and the data at t0 − 0.221 kyr, which correspond to the beginning of the adiabatic collapse phase. Right plots: last output, when we stop the simulation.
Current usage metrics show cumulative count of Article Views (full-text article views including HTML views, PDF and ePub downloads, according to the available data) and Abstracts Views on Vision4Press platform.
Data correspond to usage on the plateform after 2015. The current usage metrics is available 48-96 hours after online publication and is updated daily on week days.
Initial download of the metrics may take a while.