Fig. 4
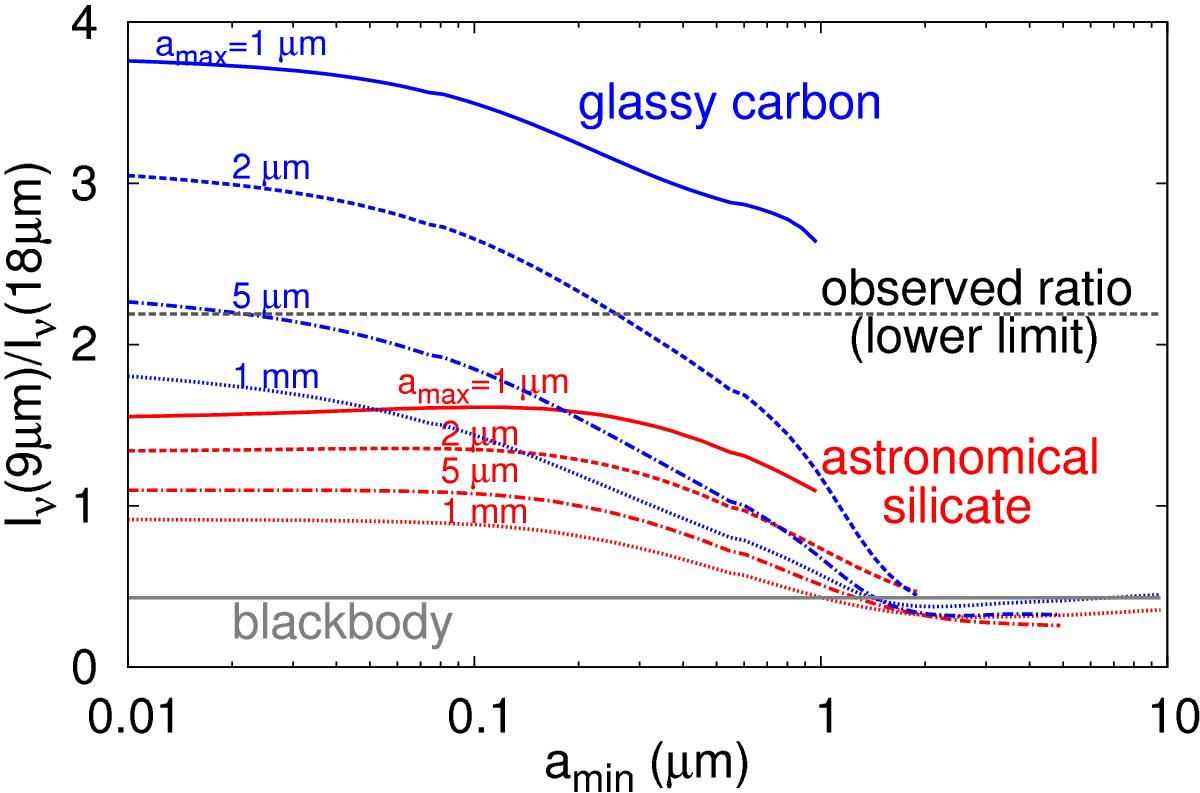
Observed intensity ratio (lower limit) of Iν(9 μm)/Iν(18 μm) (black dashed line) is compared with expected intensity ratios as a function of amin for different amax and dust compositions. The red, blue, and gray curves indicate astronomical silicate, glassy carbon, and bulk dust emitting blackbody radiation, respectively. For astronomical silicate and glassy carbon, the solid, dashed, dash-dotted, and dotted curves indicate amax of 1 μm, 2 μm, 5 μm, and 1 mm, respectively.
Current usage metrics show cumulative count of Article Views (full-text article views including HTML views, PDF and ePub downloads, according to the available data) and Abstracts Views on Vision4Press platform.
Data correspond to usage on the plateform after 2015. The current usage metrics is available 48-96 hours after online publication and is updated daily on week days.
Initial download of the metrics may take a while.