Fig. 3
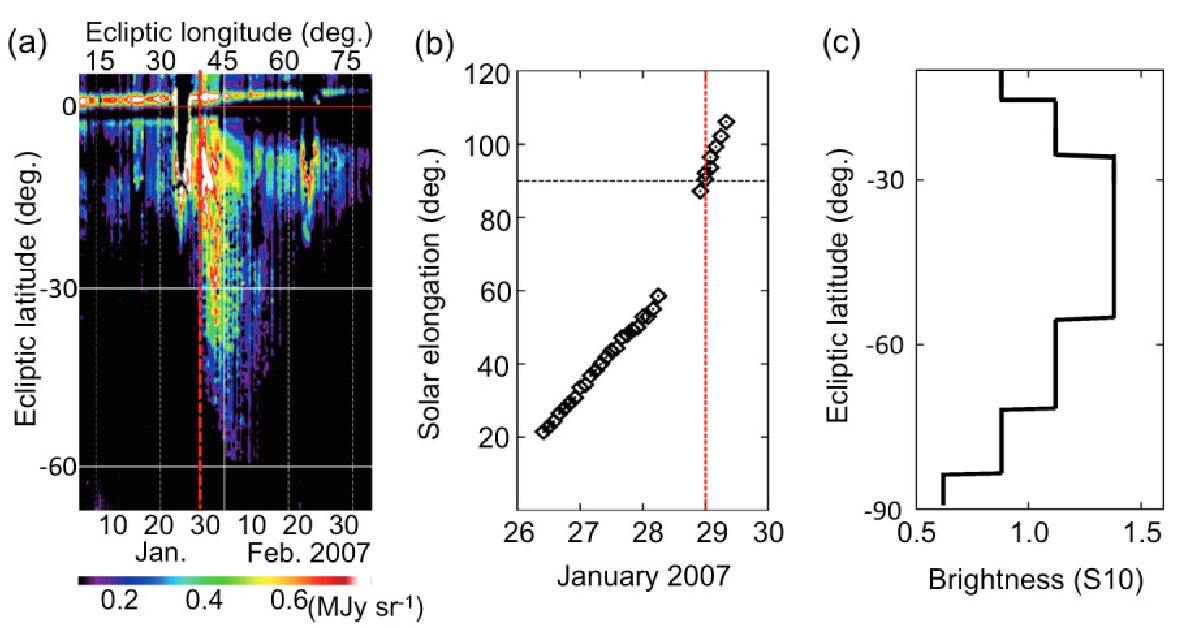
a) Enlarged view of the difference between the trailing-side map and the leading-side map in the 9 μm band around the extended bright residual component. The corresponding observation date is shown in the lower horizontal axis. The direction of the horizontal axis is opposite to that in Fig. 2. The likely local cloud is recognized for about 15 days from 2007 January 29 as indicated by the red line. b) Solar elongation of the CME front as a function of date, obtained by observations with the STEREO/HI2 and the Coriolis/SMEI (Webb et al. 2009). The red line indicates the same date as that in panel a), while the black dotted line corresponds to the solar elongation of 90°. c) CME brightness profile taken by the SMEI in the south region on the trailing side along the solar elongation of 90° on 2007 January 29.
Current usage metrics show cumulative count of Article Views (full-text article views including HTML views, PDF and ePub downloads, according to the available data) and Abstracts Views on Vision4Press platform.
Data correspond to usage on the plateform after 2015. The current usage metrics is available 48-96 hours after online publication and is updated daily on week days.
Initial download of the metrics may take a while.