Free Access
Fig. 2
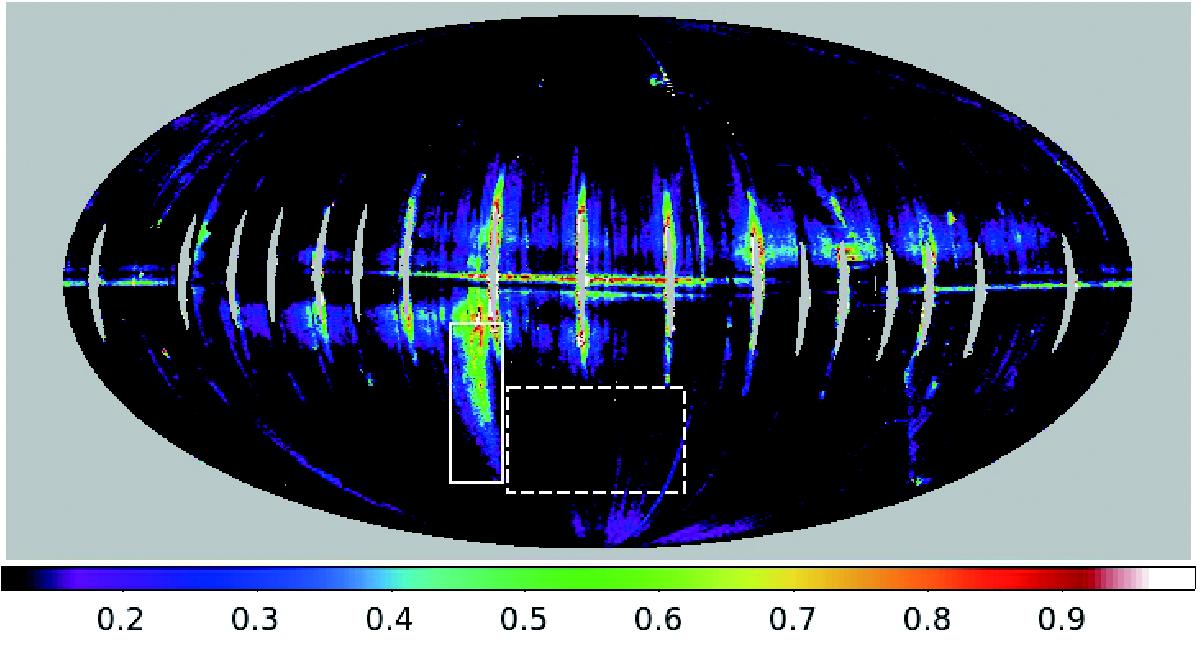
Difference between the trailing-side map and the leading-side map in the 9 μm band. The position and the size of the solid box is the same as that in Fig. 1a. The dashed box indicates the area of 54° × 34° with the centre at (λ,β) = (354°, − 47°), where the brightness fluctuations are measured.
Current usage metrics show cumulative count of Article Views (full-text article views including HTML views, PDF and ePub downloads, according to the available data) and Abstracts Views on Vision4Press platform.
Data correspond to usage on the plateform after 2015. The current usage metrics is available 48-96 hours after online publication and is updated daily on week days.
Initial download of the metrics may take a while.