Free Access
Fig. 8
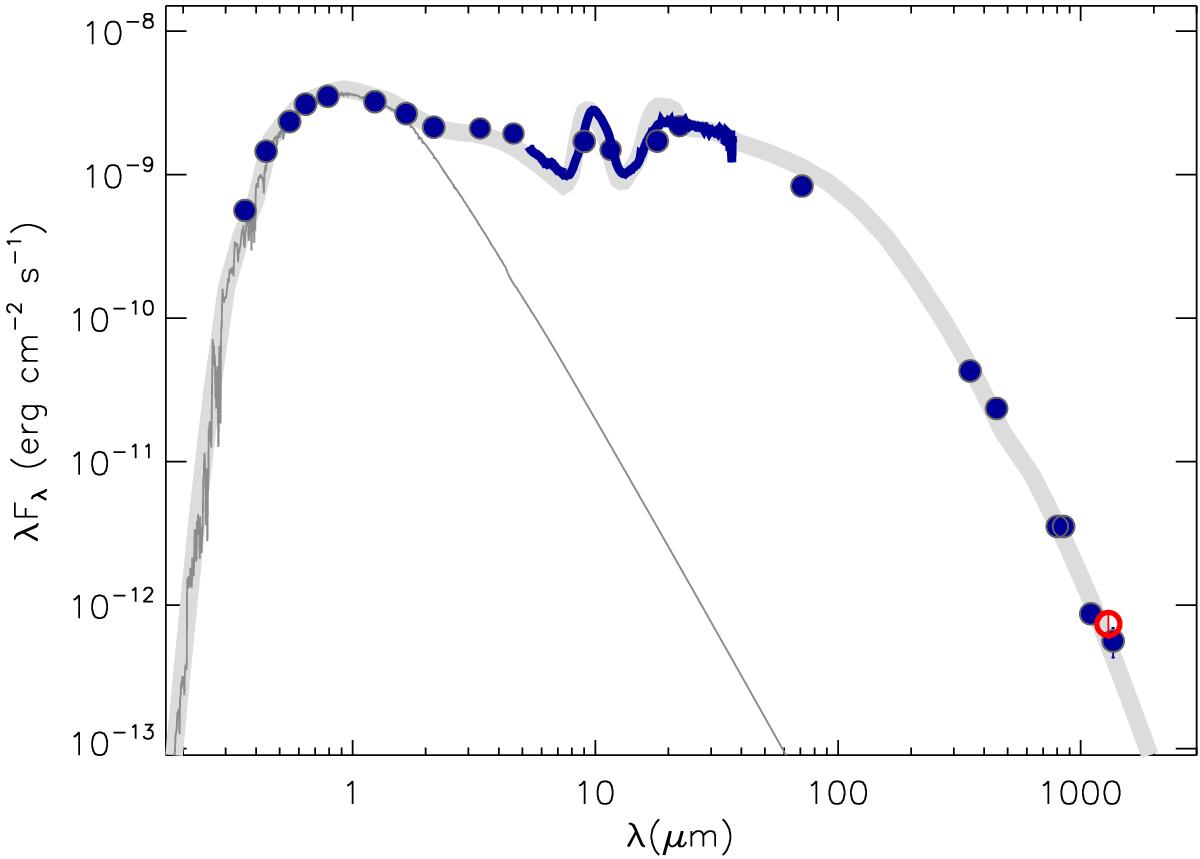
Observed SED of GW Ori. The broadband photometry is shown with the filled circles, and the IRS spectrum of this source is indicated by a solid line. The open circle shows the flux from our SMA observations. The thick gray line shows our model SED. The photospheric emission level is indicated by a thin gray curve.
Current usage metrics show cumulative count of Article Views (full-text article views including HTML views, PDF and ePub downloads, according to the available data) and Abstracts Views on Vision4Press platform.
Data correspond to usage on the plateform after 2015. The current usage metrics is available 48-96 hours after online publication and is updated daily on week days.
Initial download of the metrics may take a while.