Fig. 6
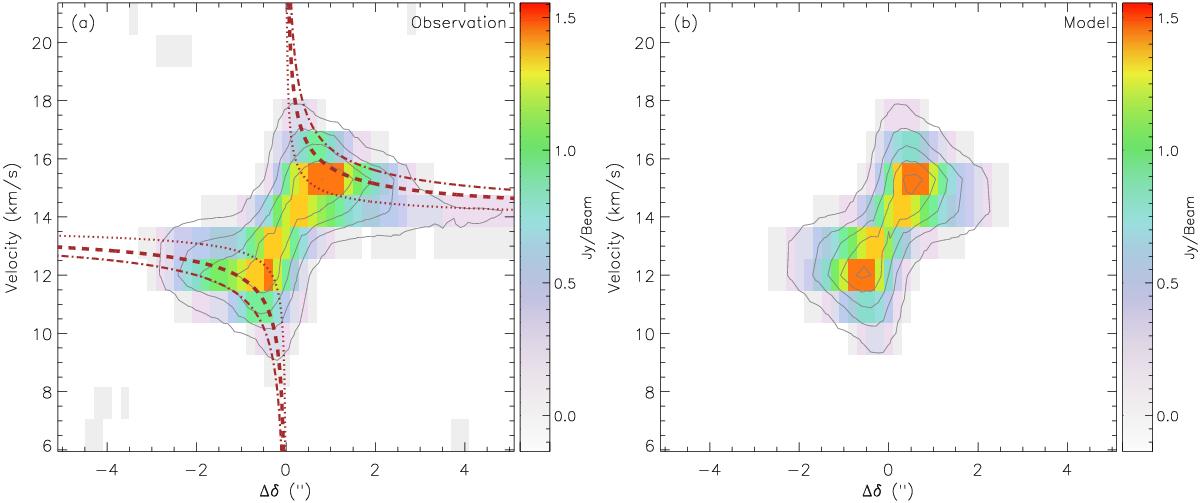
a) Observed position-velocity diagram from the 12CO J = 2−1 map along the north-south direction across GW Ori. The offset refers to the distance along the cut from GW Ori. The contours start at 0.15 Jy beam-1 (3σ) with an interval of 0.05 Jy beam-1 (1σ). The dotted, dashed, and dash-dotted lines show a Keplerian rotation curve with a central mass of 3.9 M⊙ with disk inclinations of 20°, 40°, and 60°, respectively. b) Same as in panel a), but for the modeled position-velocity diagram with a disk inclination of 35°.
Current usage metrics show cumulative count of Article Views (full-text article views including HTML views, PDF and ePub downloads, according to the available data) and Abstracts Views on Vision4Press platform.
Data correspond to usage on the plateform after 2015. The current usage metrics is available 48-96 hours after online publication and is updated daily on week days.
Initial download of the metrics may take a while.