Fig. 2
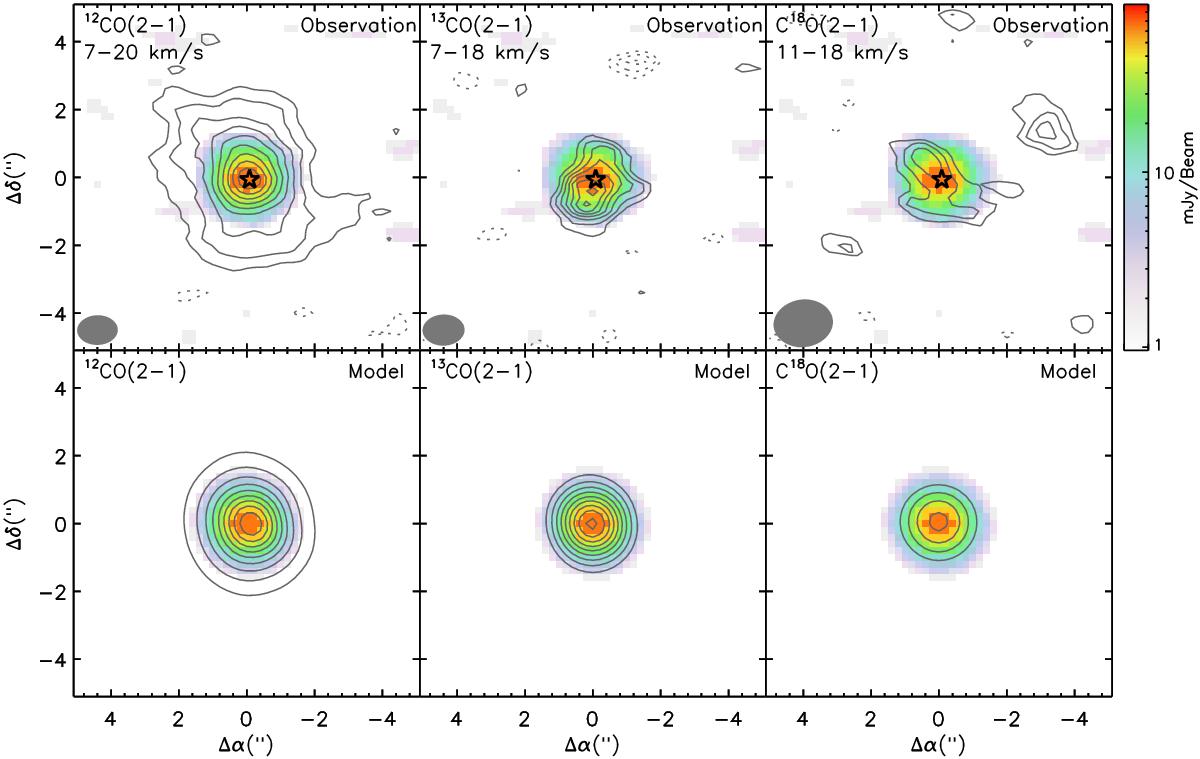
Top panels: velocity-integrated intensities (contours) for the 12CO J = 2−1, 13CO J = 2−1, and C18O J = 2−1 line emission, overlaid on the continuum emission. For 12CO J = 2−1, the intensities are integrated over the velocity range between 6.5 and 20.8 km s-1; the contours are drawn at 0.69 Jy beam-1 km s-1 (3σ) intervals, starting at 0.69 Jy beam-1 km s-1 (3σ). For 13CO J = 2−1, the intensities are integrated over the velocity range between 7 and 20 km s-1; the contours start at 0.48 Jy beam-1 km s-1 (3σ) with an interval of 0.16 Jy beam-1 km s-1 (1σ). For C18O J = 2−1, the intensities are integrated over the velocity range between 7 and 20 km s-1; the contours begin at 0.24 Jy beam-1 km s-1 (3σ) and increase in 0.08 Jy beam-1 km s-1 (1σ) increments. In each panel, the negative contours (dashed lines) are drawn at −1σ intervals, starting at −3σ. The synthesized beam for each line emission is shown in the lower left corner in each panel. Bottom panels: modeled velocity-integrated intensities (contours) for the 12CO J = 2−1, 13CO J = 2−1, and C18O J = 2−1 line emission, overlaid on the modeled continuum emission for the GW Ori disk system. The contour levels are the same as in the top panels at the corresponding molecular lines.
Current usage metrics show cumulative count of Article Views (full-text article views including HTML views, PDF and ePub downloads, according to the available data) and Abstracts Views on Vision4Press platform.
Data correspond to usage on the plateform after 2015. The current usage metrics is available 48-96 hours after online publication and is updated daily on week days.
Initial download of the metrics may take a while.