Fig. 1
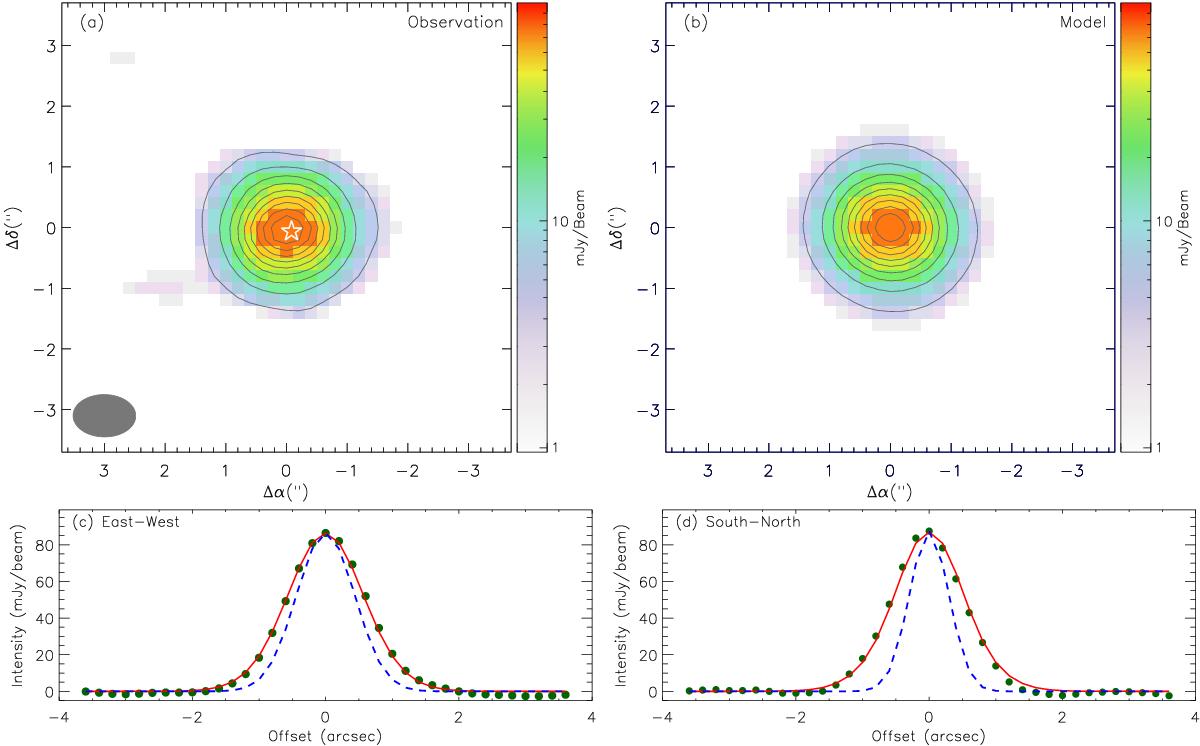
a) Observed map of the continuum emission observed toward GW Ori at a wavelength of 1.3 mm, with contours (solid lines) drawn at 9.5 mJy beam-1 (10σ) intervals, starting at 4.8 mJy beam-1 (5σ). The synthesized beam is shown in the lower left corner. The position of the central star is indicated with the star symbol. b) Modeled map of the continuum emission for the GW Ori disk system at a wavelength of 1.3 mm. The contour levels are the same as in panel a). c), d) Distribution of the observed intensities (filled circles) along the east-west c) and north-south d) directions across the center of the map compared with the our model (solid lines). The dashed lines show the expected profiles for an unresolved object.
Current usage metrics show cumulative count of Article Views (full-text article views including HTML views, PDF and ePub downloads, according to the available data) and Abstracts Views on Vision4Press platform.
Data correspond to usage on the plateform after 2015. The current usage metrics is available 48-96 hours after online publication and is updated daily on week days.
Initial download of the metrics may take a while.