Fig. 5
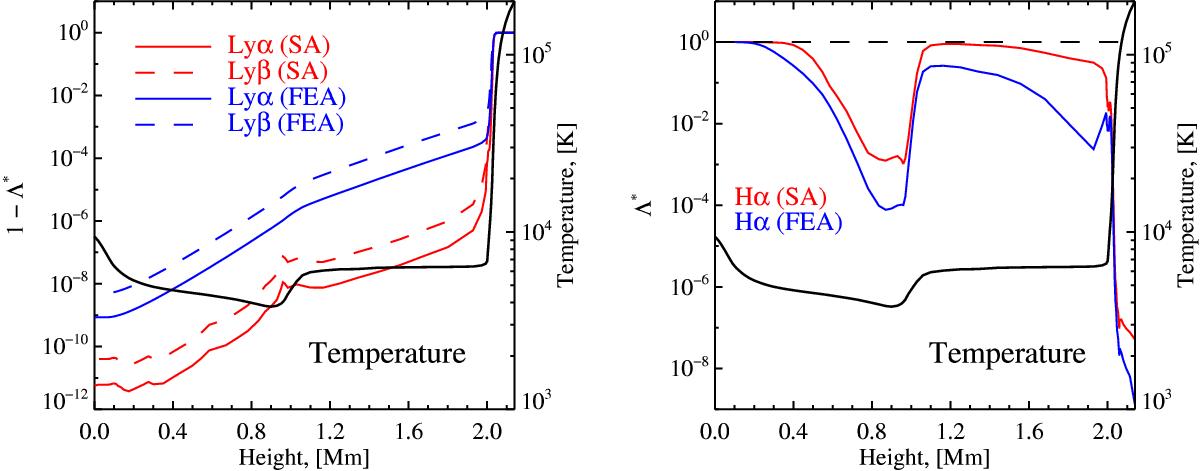
Local operator element Λ∗ as a function of height for SA and FEA velocity profiles. The left panel shows 1−Λ∗ for Lyα and Lyβ lines. The right panel shows Λ∗ for Hα line. The figure is plotted for the default value of the Doppler broadening velocity ![]() km s-1. The black curve, corresponding to the right y-axis in both panels, shows the temperature profile of the FCHHT-B solar atmosphere model (Fontenla et al. 2009).
km s-1. The black curve, corresponding to the right y-axis in both panels, shows the temperature profile of the FCHHT-B solar atmosphere model (Fontenla et al. 2009).
Current usage metrics show cumulative count of Article Views (full-text article views including HTML views, PDF and ePub downloads, according to the available data) and Abstracts Views on Vision4Press platform.
Data correspond to usage on the plateform after 2015. The current usage metrics is available 48-96 hours after online publication and is updated daily on week days.
Initial download of the metrics may take a while.