Fig. 3
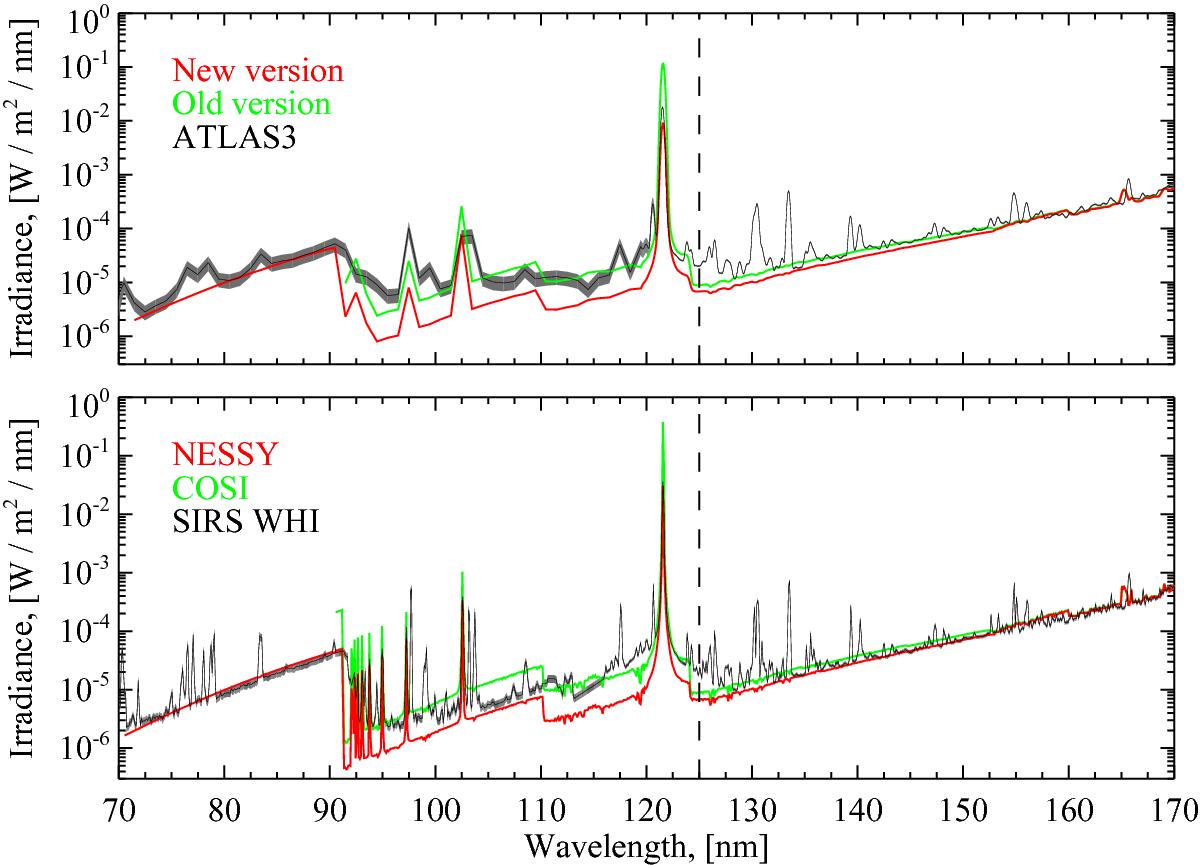
Comparison of COSI (S2010) and NESSY spectra to the ATLAS3 (Thuillier et al. 2004) and SIRS WHI (Woods et al. 2009) observations. COSI spectrum is available only from 90 nm onward. The gray areas show the uncertainties of the observed spectra. Longward of about 115 nm the uncertainties become indiscernible on the logarithmic scale. The dashed line in both panels designates the wavelength below which the COSI spectrum in S2010 was not shown because the authors have been aware of the non-converged hydrogen level populations in the outer atmospheric layers.
Current usage metrics show cumulative count of Article Views (full-text article views including HTML views, PDF and ePub downloads, according to the available data) and Abstracts Views on Vision4Press platform.
Data correspond to usage on the plateform after 2015. The current usage metrics is available 48-96 hours after online publication and is updated daily on week days.
Initial download of the metrics may take a while.