Fig. 6
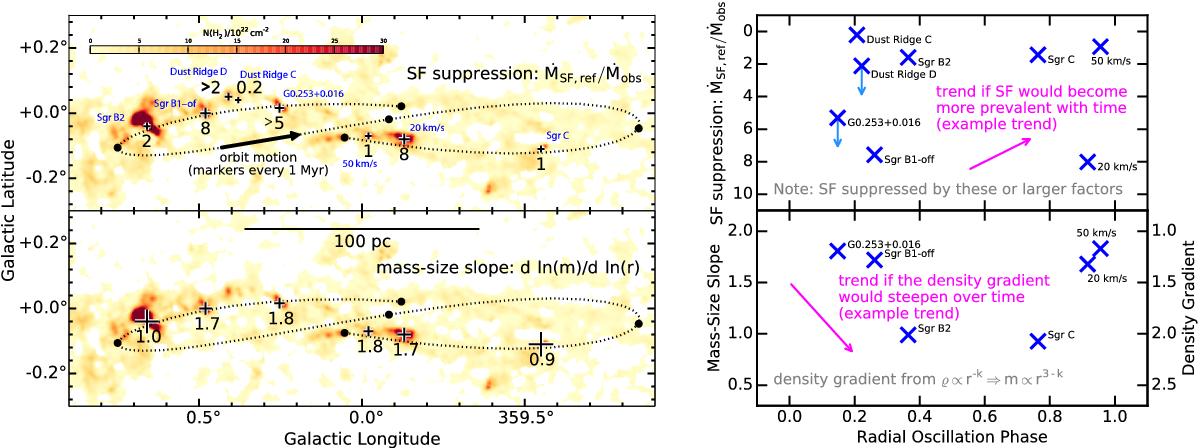
Spatial distribution of cloud properties. Blue labels in the top map give cloud names. Symbol sizes and labels in the top map indicate the factor by which the star formation activity in the dense gas is suppressed relative to a typical Milky Way reference value provided by Eq. (5). Symbol sizes and labels in the bottom map give the mass-size slope derived from the cloud structure data on spatial scales ≲1 pc. A dotted line in the maps shows part of the orbit for CMZ clouds proposed by Kruijssen et al. (2015). The background maps present a column density map derived from Herschel dust emission data, as derived in this paper. The panels on the right show the same information on SF suppression and mass-size slopes as a function of the radial phase of the orbit proposed by Kruijssen et al. (2015). The magenta arrows indicate very roughly how a property might change, for example, if SF suppression would decrease over time or in case density gradients would steepen over time; the directions of the arrows matter (i.e., up or down vs. phase), but their position or placement does not. In summary the observed trends suggests that clouds do not follow a systematic evolutionary pattern as they orbit the CMZ.
Current usage metrics show cumulative count of Article Views (full-text article views including HTML views, PDF and ePub downloads, according to the available data) and Abstracts Views on Vision4Press platform.
Data correspond to usage on the plateform after 2015. The current usage metrics is available 48-96 hours after online publication and is updated daily on week days.
Initial download of the metrics may take a while.