Fig. 3
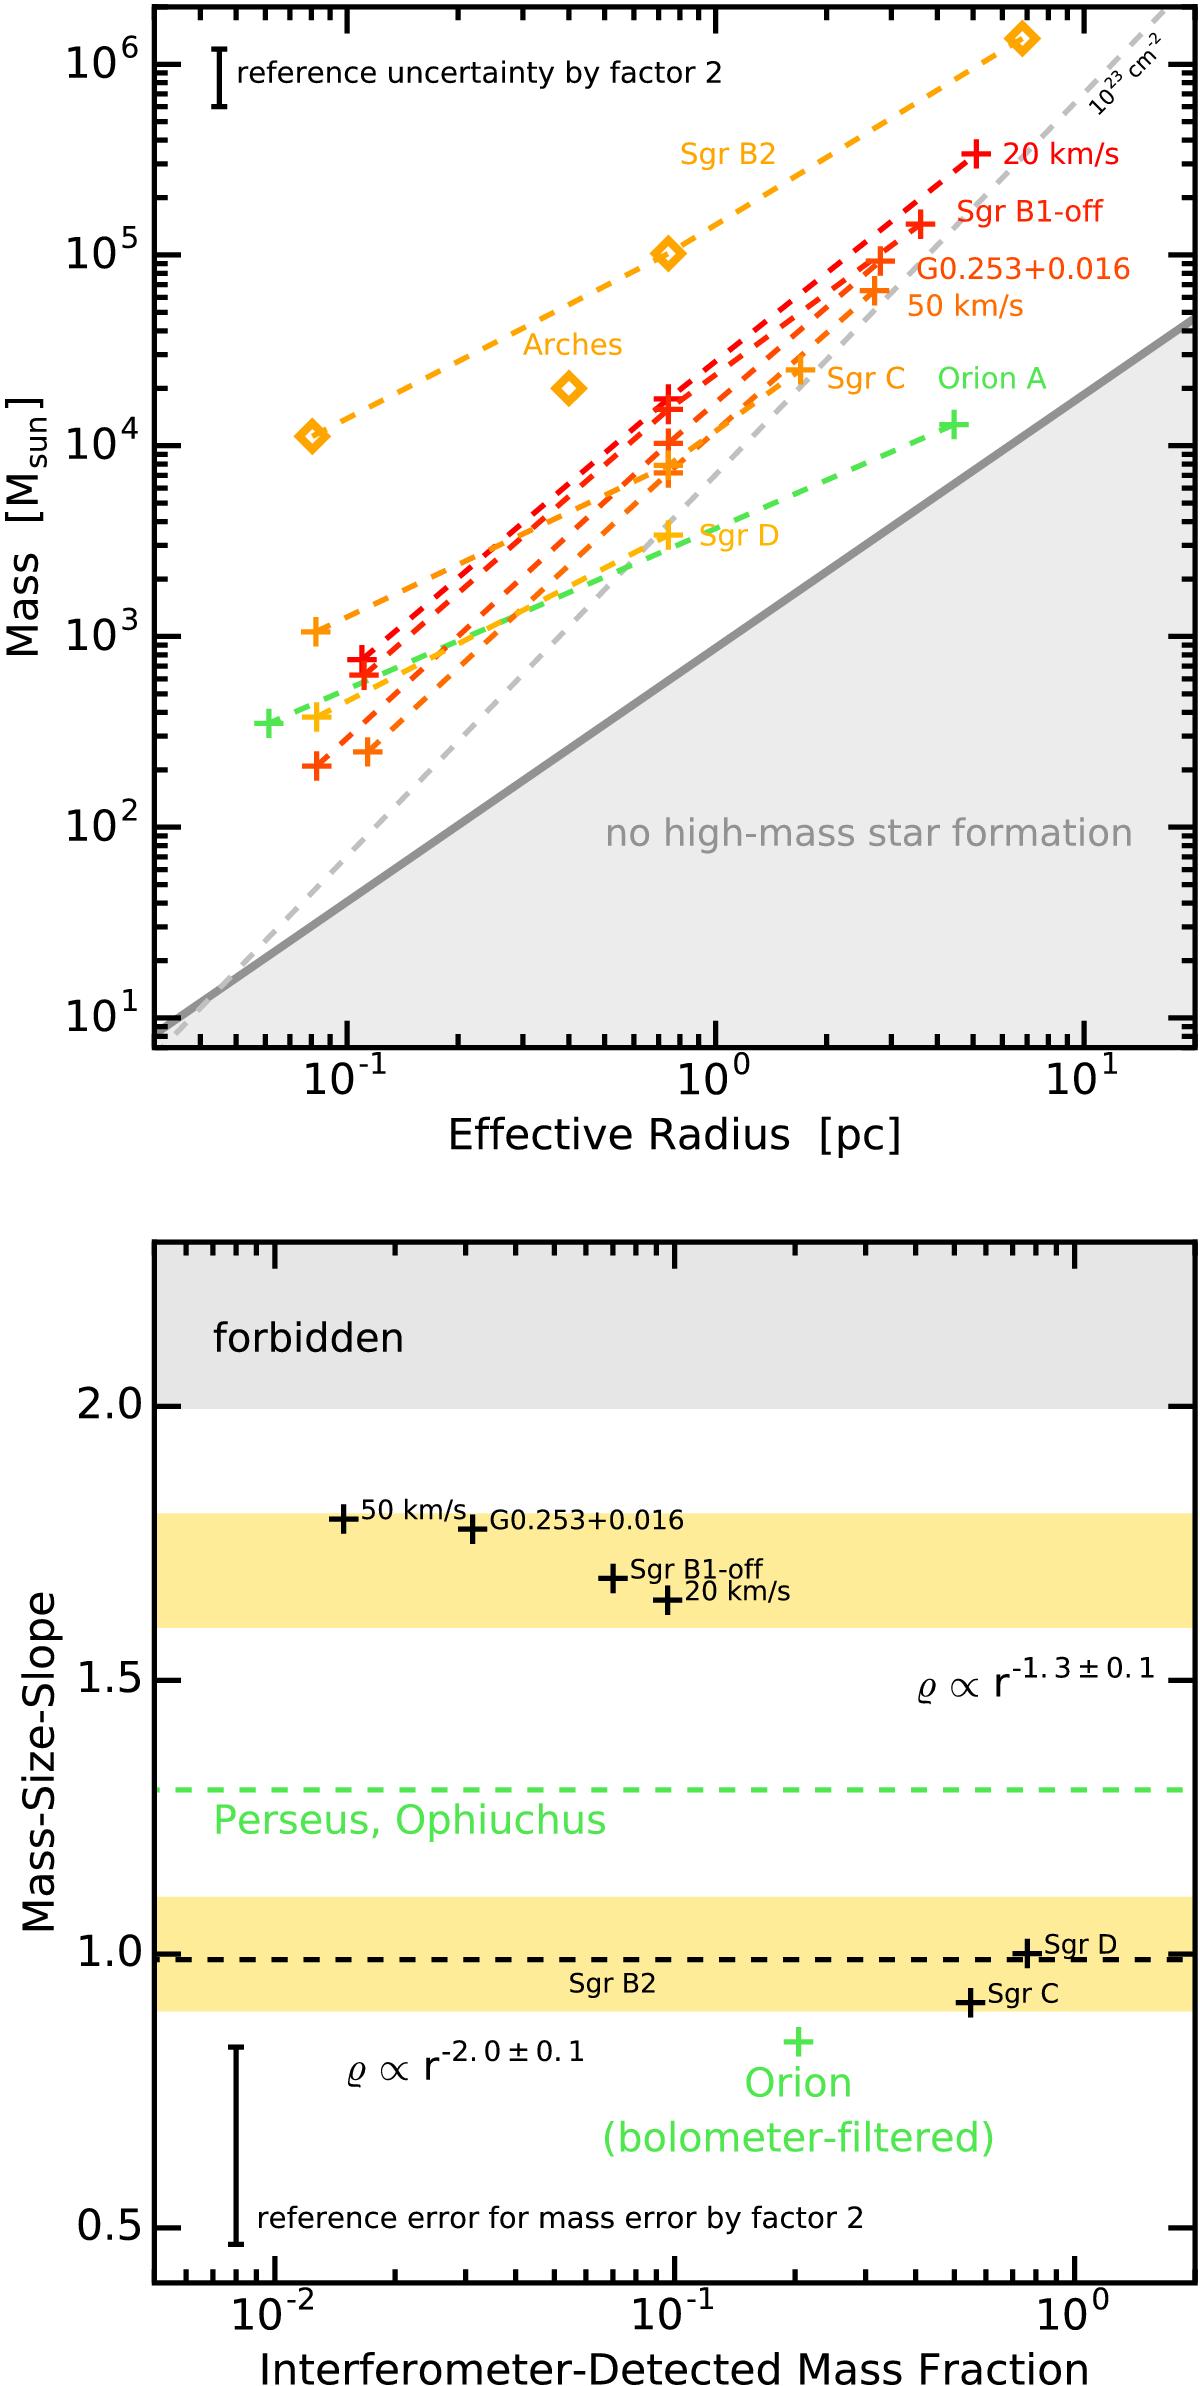
Analysis of the density structure of CMZ clouds. Top panel: mass-size data extracted for apertures of various sizes. See Sect. 2.1 for details. For reference, the gray shading indicates the region of the parameter space where high-mass stars cannot form (Kauffmann & Pillai 2010). The gray dashed line indicates a mean H2 column density of 1023 cm-2. The ordinate in the lower panel denotes the mass-size slope dln(m) / dln(r) measured in the upper panel on spatial scales ≲1 pc, as explained in Sect. 4.1. The abscissa indicates the fraction of mass measured in the interferometer data that we consider to be the dense gas tracer. Horizontal lines are drawn for some regions for which only mass-size data are available (i.e., Perseus, Ophiuchus, and Sgr B2). Shaded regions highlight the parameter space occupied by spheres with indicated singular power-law density profiles. Green lines and markers present data from reference objects outside the CMZ. The gray shaded region contains solutions that are inconsistent with a fundamental assumption made in our analysis, that is, that column densities decrease with increasing effective radius. Error bars in both panels indicate the change in properties in case the mass would change by a factor 2.
Current usage metrics show cumulative count of Article Views (full-text article views including HTML views, PDF and ePub downloads, according to the available data) and Abstracts Views on Vision4Press platform.
Data correspond to usage on the plateform after 2015. The current usage metrics is available 48-96 hours after online publication and is updated daily on week days.
Initial download of the metrics may take a while.