Fig. 2
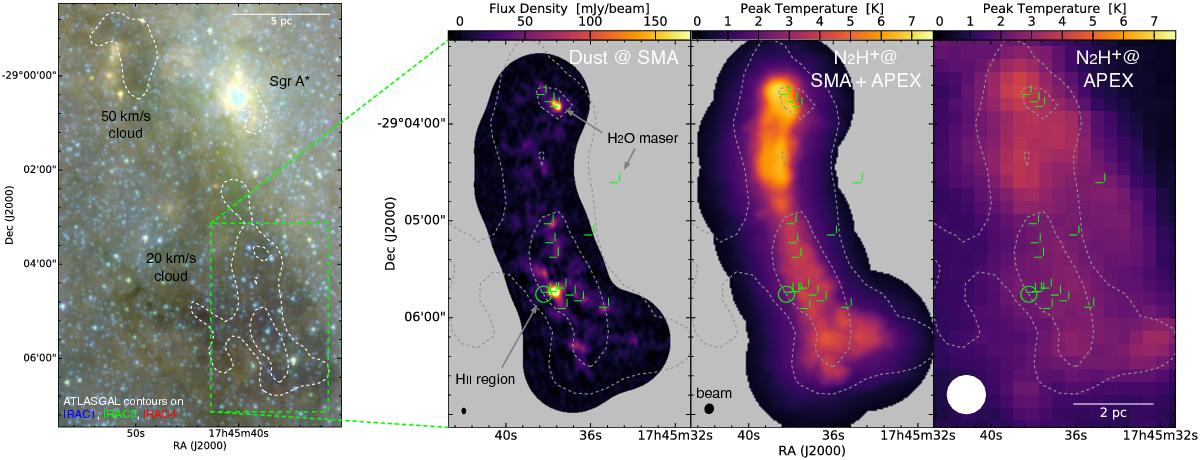
Example observations of the 20 km s-1 cloud. Left panel: shows Spitzer IRAC data. Right panel: dust continuum emission near 280 GHz as observed by the SMA, combined APEX and SMA observations of the H2H+ (3–2) transition, and APEX-only observations of the H2H+ (3–2) transition covering a larger area. All panels are overlaid with contours of single-dish dust continuum emission at 870 μm wavelength from APEX at arbitrary chosen levels. We show SMA data not corrected for primary beam and missing extended emission to improve our visualization. The green circle indicates the location of an H ii region found by Ho et al. (1985), while green crosses indicate the location of water masers discovered by Lu et al. (2015).
Current usage metrics show cumulative count of Article Views (full-text article views including HTML views, PDF and ePub downloads, according to the available data) and Abstracts Views on Vision4Press platform.
Data correspond to usage on the plateform after 2015. The current usage metrics is available 48-96 hours after online publication and is updated daily on week days.
Initial download of the metrics may take a while.