Fig. 1
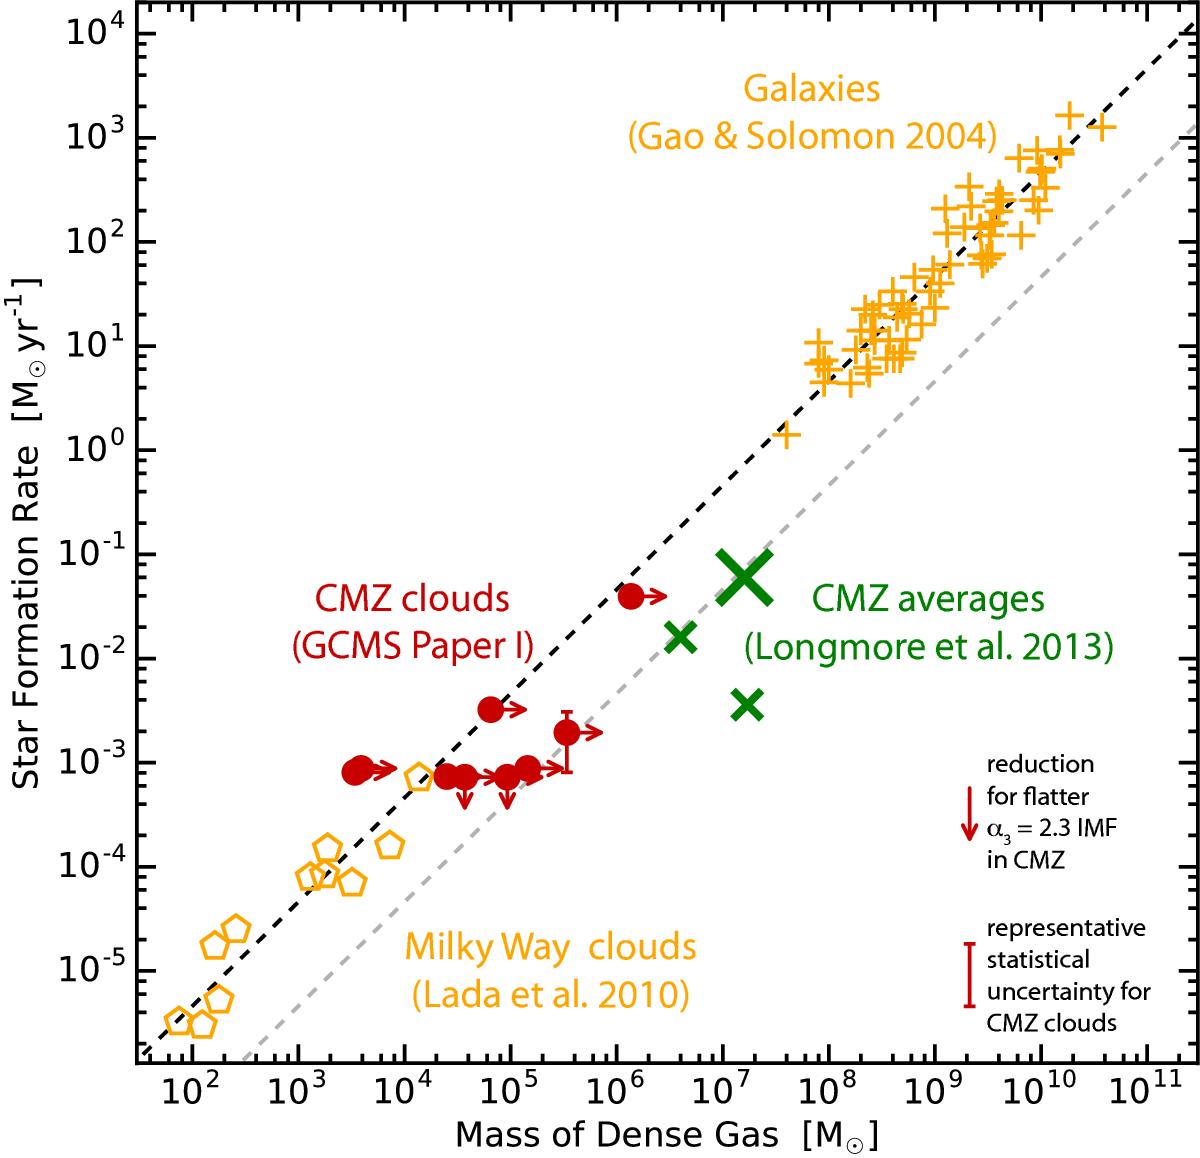
Observed star formation rates vs. the mass of dense gas residing at visual extinctions AV> 7 mag. Yellow diamonds indicate the properties of molecular clouds within about 500 pc from sun compiled by Lada et al. (2010). The yellow crosses denote the Gao & Solomon (2004) data for star formation in entire galaxies, as recalibrated by Lada et al. (2012). The large green cross indicates the CMZ star formation rate for the | ℓ | ≤ 1° region largely explored by this paper, while the smaller green crosses show further regions explored by Longmore et al. (2013a). The red bullets indicate masses and star formation rates for individual CMZ clouds discussed in this paper (see Paper I for details); the uncertainties illustrated by red error bars and arrows are shown in the lower right corner. The black dashed line indicates a fit to the Lada et al. (2010) data taken from the same publication. The gray dashed line gives a relation with a star formation rate that is lower by a factor 10.
Current usage metrics show cumulative count of Article Views (full-text article views including HTML views, PDF and ePub downloads, according to the available data) and Abstracts Views on Vision4Press platform.
Data correspond to usage on the plateform after 2015. The current usage metrics is available 48-96 hours after online publication and is updated daily on week days.
Initial download of the metrics may take a while.