Fig. 2
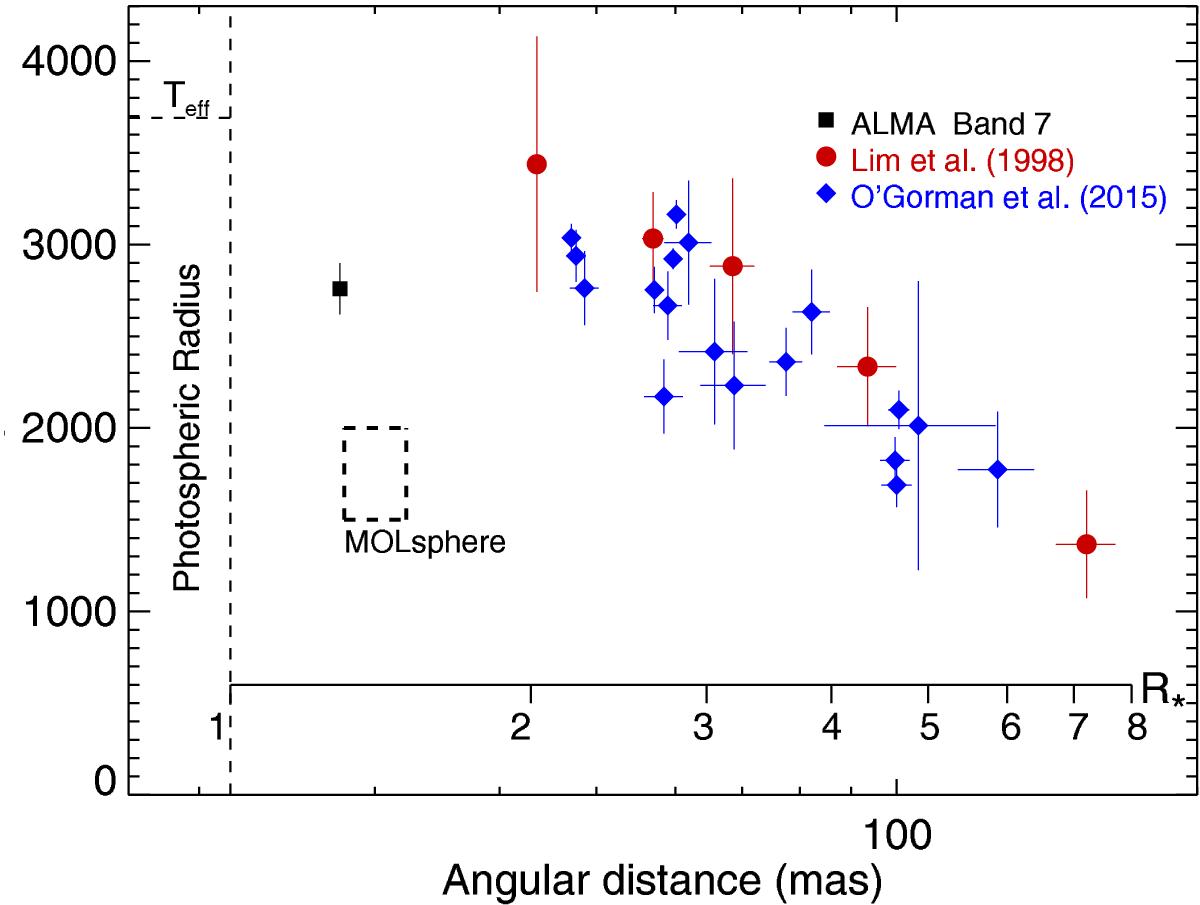
Semi-log plot of the temperature profile of Betelgeuse’s extended atmosphere. The red filled circles and blue filled diamonds represent the gas temperature derived from multi-epoch spatially resolved radio observations (Lim et al. 1998; O’Gorman et al. 2015a). The large black dashed rectangle is the approximate location and temperature range of the MOLsphere. The black filled square is our ALMA band 7 temperature which shows that the mean gas temperature has dropped well below the effective temperature at ~1.3 R⋆.
Current usage metrics show cumulative count of Article Views (full-text article views including HTML views, PDF and ePub downloads, according to the available data) and Abstracts Views on Vision4Press platform.
Data correspond to usage on the plateform after 2015. The current usage metrics is available 48-96 hours after online publication and is updated daily on week days.
Initial download of the metrics may take a while.