Fig. C.1
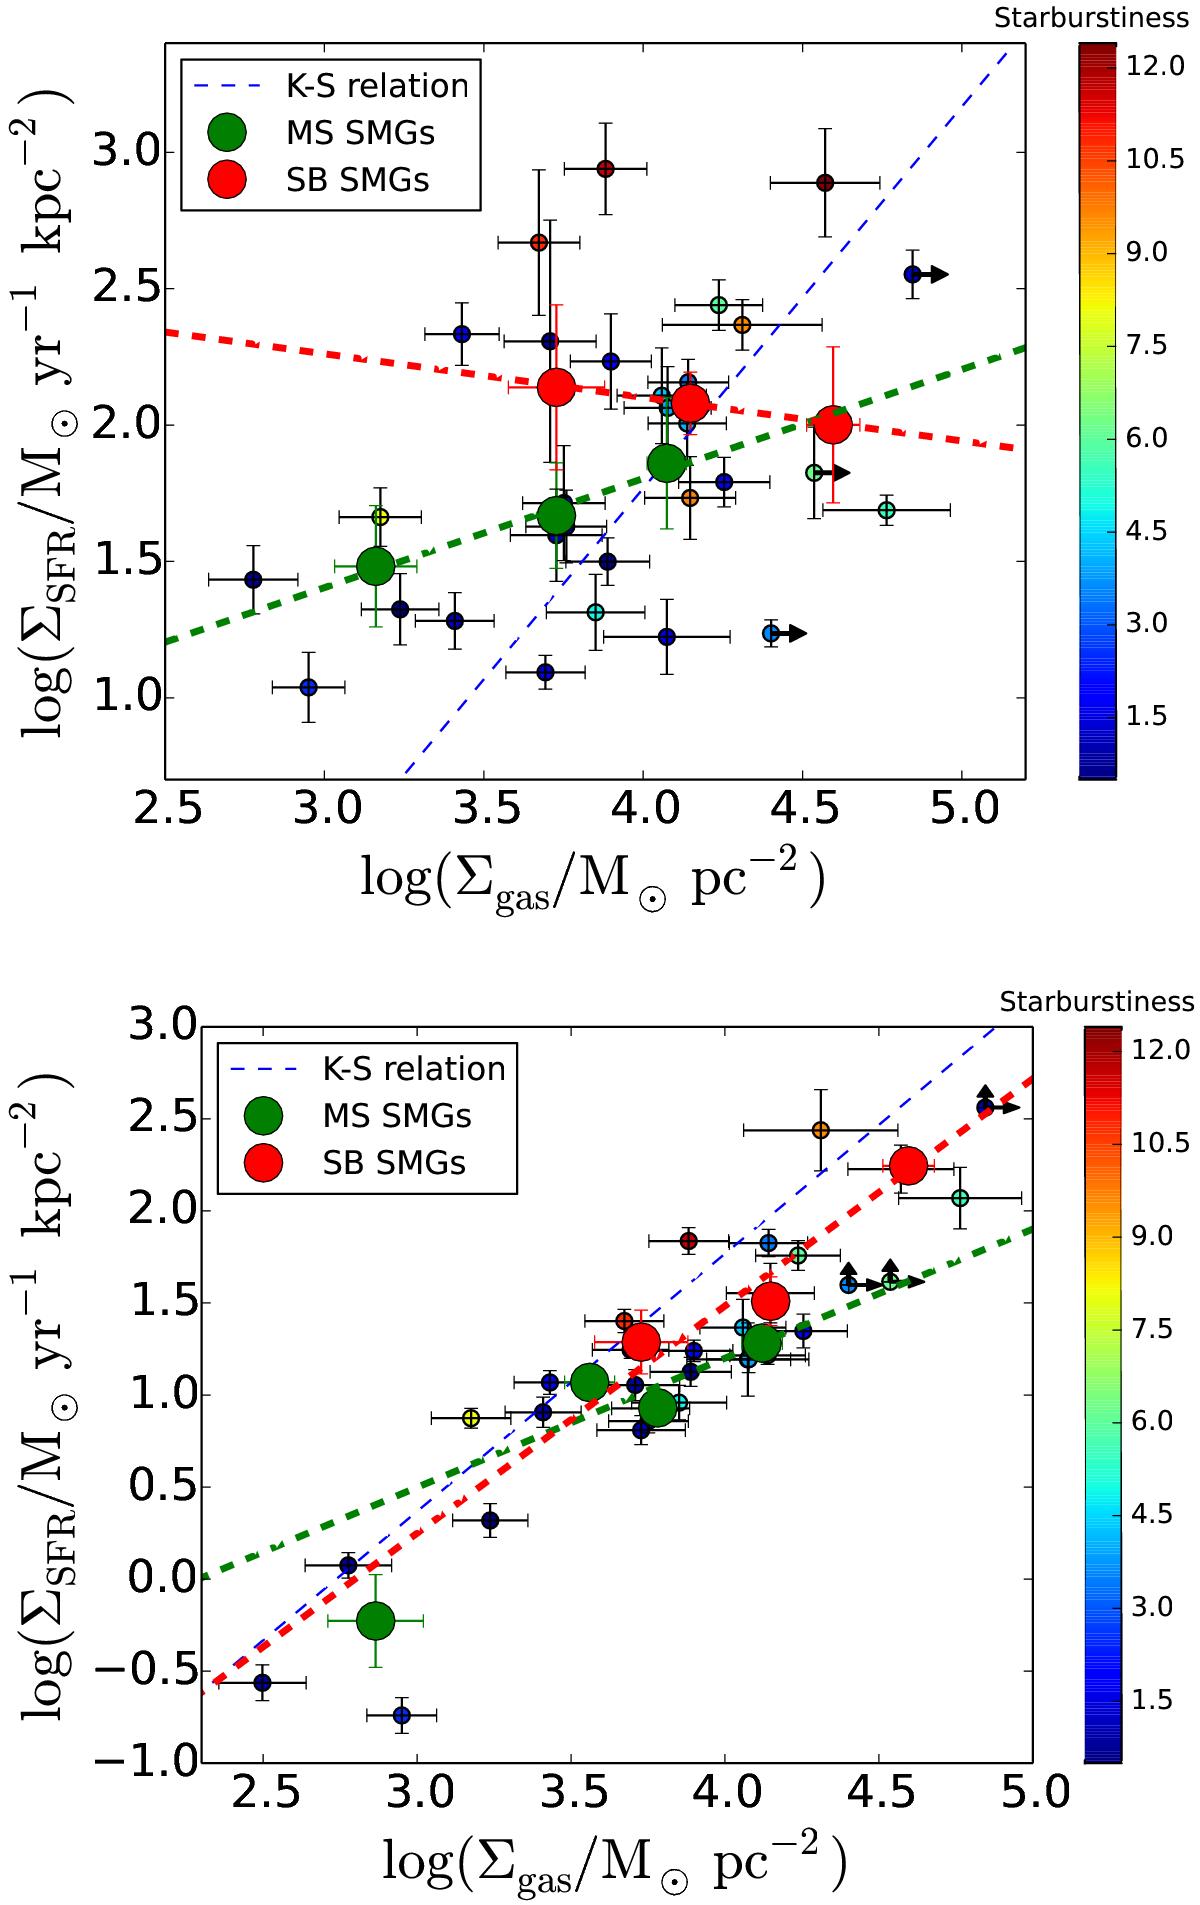
Top: similar to Fig. 1, but Σgas was calculated over the 3 GHz radio sizes derived by M17a (the magenta ellipses in Fig. A.1). Each bin contains five sources. Bottom: similar to the top panel, but both Σgas and ΣSFR were calculated over the 3 GHz radio sizes. Each MS (SB) bin contains four (five) sources, where the one additional source compared to the top panel is the 3 GHz detected SMG AzTEC/C8b. In both panels, the three sources unresolved at 3 GHz (lower limit to Σgas in the top panel, and to both Σgas and ΣSFR in the bottom panel) were incorporated into the binned averages using a right-censored K-M survival analysis. The K98 relationship is shown for comparison. The plotting ranges of the two panels are different for legibility purposes.
Current usage metrics show cumulative count of Article Views (full-text article views including HTML views, PDF and ePub downloads, according to the available data) and Abstracts Views on Vision4Press platform.
Data correspond to usage on the plateform after 2015. The current usage metrics is available 48-96 hours after online publication and is updated daily on week days.
Initial download of the metrics may take a while.