Fig. 1
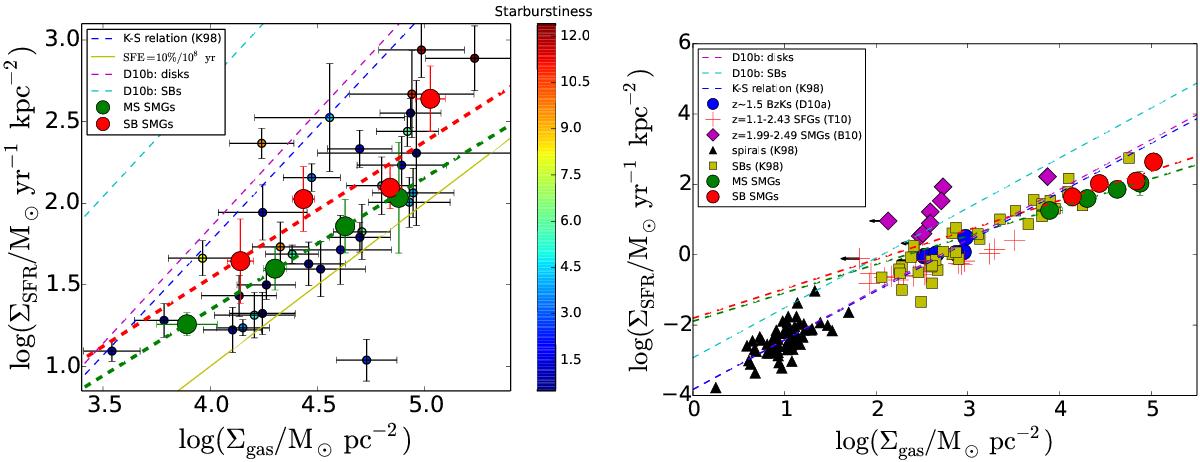
Left: Kennicutt-Schmidt diagram for the target SMGs. The individual data points are colour-coded with the distance from the Speagle et al. (2014) MS as shown in the colour-bar on the right. The green and red filled circles represent the mean values of the binned MS and starburst data, where the latter population is defined as lying above the MS by a factor of > 3. Each bin contains four SMGs, and the error bars represent the standard errors of the mean values (see Table A.2). The green and red dashed lines represent the least squares fits to the binned data sets, the blue dashed line shows the K98 relationship, and the magenta and cyan dashed lines show the D10b relations for disks and starbursts, respectively. For reference, the yellow solid line corresponds to a constant global SFE of 10% per 100 Myr, which corresponds to a gas depletion time of τdep = 1 Gyr. Right: binned averages from the left panel compared with selected literature studies. The black triangles and yellow squares show the spiral galaxy and starburst data from K98, respectively, the red plus signs show the z = 1.10−2.43 star-forming galaxy data from Tacconi et al. (2010), the blue circles show the z = 1.414−1.6 BzK-selected disk galaxies from Daddi et al. (2010a), and the magenta diamonds represent the z = 1.21−2.49 SMG data from Bothwell et al. (2010). The arrows pointing left indicate upper limits to Σgas. The dashed lines have the same meaning as in the left panel.
Current usage metrics show cumulative count of Article Views (full-text article views including HTML views, PDF and ePub downloads, according to the available data) and Abstracts Views on Vision4Press platform.
Data correspond to usage on the plateform after 2015. The current usage metrics is available 48-96 hours after online publication and is updated daily on week days.
Initial download of the metrics may take a while.