Fig. A.1
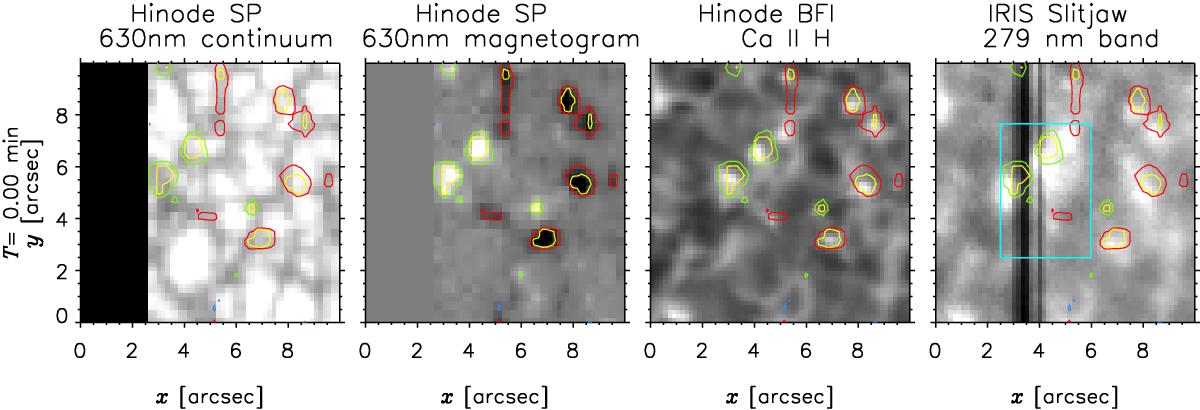
First panel: Hinode SP 6302 Å continuum maps constructed from Stokes I spectra. Part of the field-of-view is not covered by the SP slit data. The images were clipped between 10k and 16k. The following panel displays the ![]() maps clipped at ±80 Mx cm-2 retrieved with the sp_prep.pro code. This is followed by the Hinode Ca ii H image (clipped to below 1500 counts) and the IRIS 2796 Å band slitjaw image (clipped to below 200 counts). In the IRIS slitjaw images one can clearly see the IRIS slit position as a vertical dark strip. A thinner dark strip next to the slit position is due to reflections within the instrument. In all panels the contours are for ±
maps clipped at ±80 Mx cm-2 retrieved with the sp_prep.pro code. This is followed by the Hinode Ca ii H image (clipped to below 1500 counts) and the IRIS 2796 Å band slitjaw image (clipped to below 200 counts). In the IRIS slitjaw images one can clearly see the IRIS slit position as a vertical dark strip. A thinner dark strip next to the slit position is due to reflections within the instrument. In all panels the contours are for ±![]() 30 Mx cm-2 shown with green and red colors denoting opposite polarity. The yellow contours are at levels of 60 Mx cm-2 shown for both polarities. The contours for
30 Mx cm-2 shown with green and red colors denoting opposite polarity. The yellow contours are at levels of 60 Mx cm-2 shown for both polarities. The contours for ![]() 120 Mx cm-2 are in blue. The FOV marked with a square in the last column shows the area displayed in Fig. 2. The times labeled on the left refer to the recording time of the IRIS slitjaw images in the 2796 Å band. For Hinode we chose the closest frames referring to this time (see also Sect. 2 for explanation of the time frame). See online movie.
120 Mx cm-2 are in blue. The FOV marked with a square in the last column shows the area displayed in Fig. 2. The times labeled on the left refer to the recording time of the IRIS slitjaw images in the 2796 Å band. For Hinode we chose the closest frames referring to this time (see also Sect. 2 for explanation of the time frame). See online movie.
Current usage metrics show cumulative count of Article Views (full-text article views including HTML views, PDF and ePub downloads, according to the available data) and Abstracts Views on Vision4Press platform.
Data correspond to usage on the plateform after 2015. The current usage metrics is available 48-96 hours after online publication and is updated daily on week days.
Initial download of the metrics may take a while.